Cities with the Highest Median Costs of Housing in Indiana
RELATED REPORTS & OPTIONS
Highest Median Housing Costs
Indiana
Compare Cities
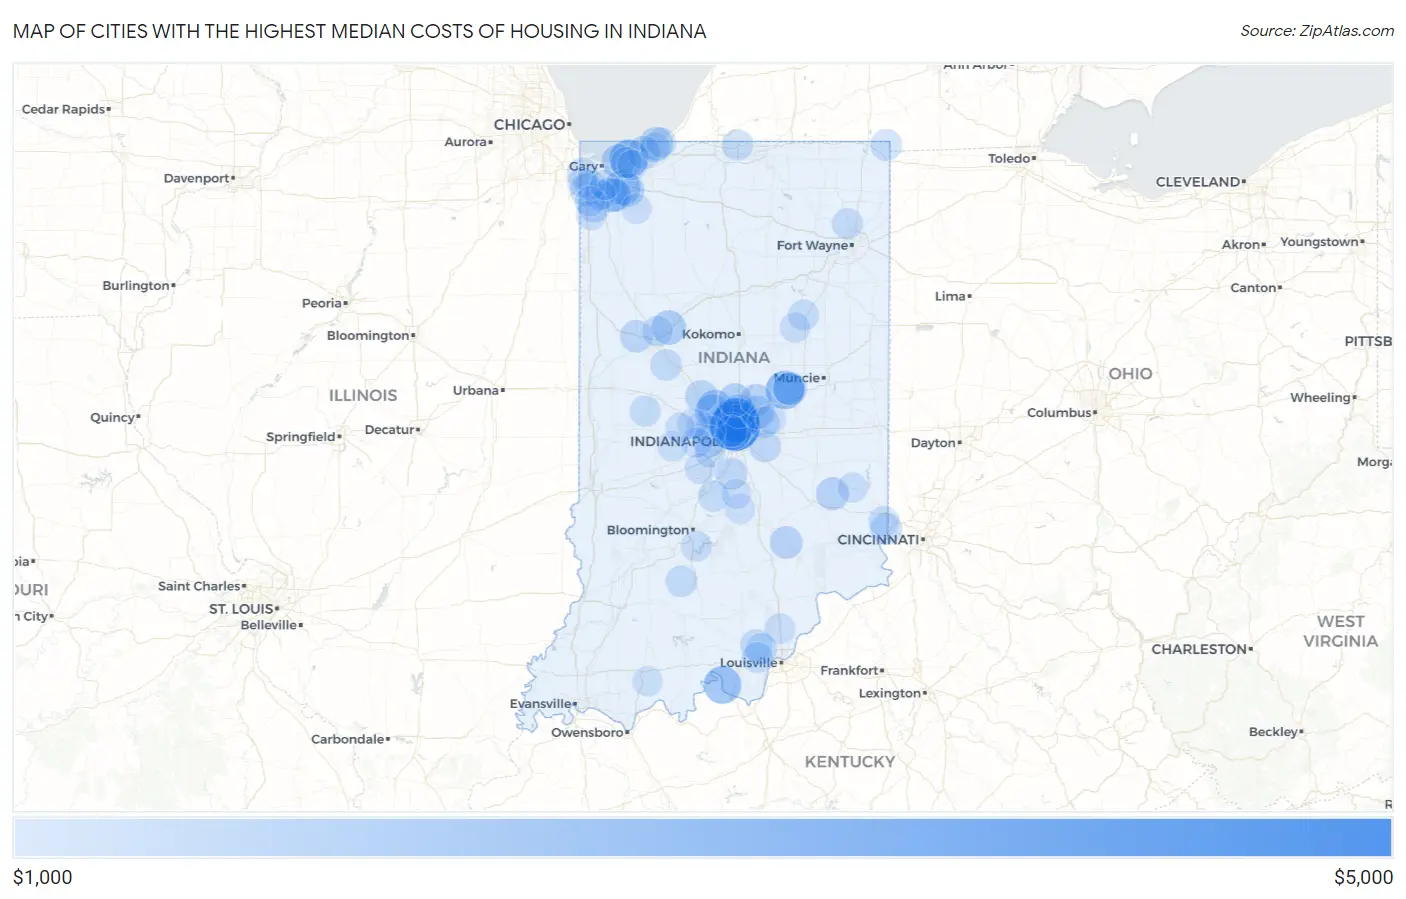
Map of Cities with the Highest Median Costs of Housing in Indiana
$0
$5,000
Cities with the Highest Median Costs of Housing in Indiana
| City | Housing Costs | vs State | vs National | |
| 1. | North Crows Nest | $4,001 | $979(+3.02k)#1 | $1,276(+2.73k)#135 |
| 2. | Williams Creek | $3,438 | $979(+2.46k)#2 | $1,276(+2.16k)#280 |
| 3. | Goldsmith | $2,668 | $979(+1.69k)#3 | $1,276(+1.39k)#801 |
| 4. | Dune Acres | $2,375 | $979(+1.40k)#4 | $1,276(+1.10k)#1,227 |
| 5. | River Forest | $2,375 | $979(+1.40k)#5 | $1,276(+1.10k)#1,228 |
| 6. | Crows Nest | $2,344 | $979(+1.36k)#6 | $1,276(+1.07k)#1,293 |
| 7. | Meridian Hills | $2,280 | $979(+1.30k)#7 | $1,276(+1.00k)#1,448 |
| 8. | New Amsterdam | $2,233 | $979(+1.25k)#8 | $1,276(+957)#1,563 |
| 9. | Spring Hill | $2,214 | $979(+1.24k)#9 | $1,276(+938)#1,620 |
| 10. | Grandview Lake | $2,182 | $979(+1.20k)#10 | $1,276(+906)#1,709 |
| 11. | Hessen Cassel | $2,107 | $979(+1.13k)#11 | $1,276(+831)#1,919 |
| 12. | Wooster | $2,060 | $979(+1.08k)#12 | $1,276(+784)#2,070 |
| 13. | Snow Lake | $1,942 | $979(+963)#13 | $1,276(+666)#2,481 |
| 14. | Zionsville | $1,906 | $979(+927)#14 | $1,276(+630)#2,616 |
| 15. | Shorewood Forest | $1,901 | $979(+922)#15 | $1,276(+625)#2,639 |
| 16. | Winfield | $1,855 | $979(+876)#16 | $1,276(+579)#2,862 |
| 17. | Americus | $1,786 | $979(+807)#17 | $1,276(+510)#3,206 |
| 18. | Rockford | $1,765 | $979(+786)#18 | $1,276(+489)#3,317 |
| 19. | Whitestown | $1,751 | $979(+772)#19 | $1,276(+475)#3,380 |
| 20. | Ogden Dunes | $1,723 | $979(+744)#20 | $1,276(+447)#3,521 |
| 21. | Long Beach | $1,685 | $979(+706)#21 | $1,276(+409)#3,749 |
| 22. | Country Club Heights | $1,675 | $979(+696)#22 | $1,276(+399)#3,805 |
| 23. | Carmel | $1,666 | $979(+687)#23 | $1,276(+390)#3,851 |
| 24. | Aberdeen | $1,655 | $979(+676)#24 | $1,276(+379)#3,913 |
| 25. | Fishers | $1,645 | $979(+666)#25 | $1,276(+369)#3,971 |
| 26. | Westfield | $1,642 | $979(+663)#26 | $1,276(+366)#3,998 |
| 27. | Lakes Of The Four Seasons | $1,609 | $979(+630)#27 | $1,276(+333)#4,237 |
| 28. | Lake Santee | $1,581 | $979(+602)#28 | $1,276(+305)#4,421 |
| 29. | Beverly Shores | $1,563 | $979(+584)#29 | $1,276(+287)#4,546 |
| 30. | St. Wendel | $1,550 | $979(+571)#30 | $1,276(+274)#4,633 |
| 31. | Scipio | $1,528 | $979(+549)#31 | $1,276(+252)#4,800 |
| 32. | Montmorenci | $1,520 | $979(+541)#32 | $1,276(+244)#4,860 |
| 33. | St John | $1,506 | $979(+527)#33 | $1,276(+230)#4,974 |
| 34. | Foxcliff Estates | $1,505 | $979(+526)#34 | $1,276(+229)#4,991 |
| 35. | Ulen | $1,500 | $979(+521)#35 | $1,276(+224)#5,032 |
| 36. | Avon | $1,481 | $979(+502)#36 | $1,276(+205)#5,158 |
| 37. | Noblesville | $1,449 | $979(+470)#37 | $1,276(+173)#5,412 |
| 38. | Lake Dalecarlia | $1,441 | $979(+462)#38 | $1,276(+165)#5,491 |
| 39. | Bargersville | $1,426 | $979(+447)#39 | $1,276(+150)#5,614 |
| 40. | New Palestine | $1,424 | $979(+445)#40 | $1,276(+148)#5,630 |
| 41. | Mccordsville | $1,422 | $979(+443)#41 | $1,276(+146)#5,643 |
| 42. | Hidden Valley | $1,420 | $979(+441)#42 | $1,276(+144)#5,660 |
| 43. | Floyds Knobs | $1,405 | $979(+426)#43 | $1,276(+129)#5,817 |
| 44. | Williamsburg | $1,403 | $979(+424)#44 | $1,276(+127)#5,838 |
| 45. | Wynnedale | $1,398 | $979(+419)#45 | $1,276(+122)#5,890 |
| 46. | Woodlawn Heights | $1,396 | $979(+417)#46 | $1,276(+120)#5,911 |
| 47. | Greenville | $1,379 | $979(+400)#47 | $1,276(+103)#6,062 |
| 48. | Lakewood | $1,375 | $979(+396)#48 | $1,276(+99.0)#6,094 |
| 49. | Clear Lake | $1,367 | $979(+388)#49 | $1,276(+91.0)#6,196 |
| 50. | Munster | $1,361 | $979(+382)#50 | $1,276(+85.0)#6,245 |
| 51. | Williams | $1,354 | $979(+375)#51 | $1,276(+78.0)#6,329 |
| 52. | Galena | $1,353 | $979(+374)#52 | $1,276(+77.0)#6,336 |
| 53. | Stockwell | $1,352 | $979(+373)#53 | $1,276(+76.0)#6,346 |
| 54. | Crown Point | $1,341 | $979(+362)#54 | $1,276(+65.0)#6,429 |
| 55. | Ramsey | $1,341 | $979(+362)#55 | $1,276(+65.0)#6,435 |
| 56. | Scott | $1,335 | $979(+356)#56 | $1,276(+59.0)#6,500 |
| 57. | Painted Hills | $1,334 | $979(+355)#57 | $1,276(+58.0)#6,506 |
| 58. | Huntertown | $1,333 | $979(+354)#58 | $1,276(+57.0)#6,513 |
| 59. | Newtonville | $1,333 | $979(+354)#59 | $1,276(+57.0)#6,526 |
| 60. | Blairsville | $1,333 | $979(+354)#60 | $1,276(+57.0)#6,527 |
| 61. | Brownsburg | $1,324 | $979(+345)#61 | $1,276(+48.0)#6,633 |
| 62. | Lake Holiday | $1,315 | $979(+336)#62 | $1,276(+39.0)#6,750 |
| 63. | Burns Harbor | $1,312 | $979(+333)#63 | $1,276(+36.0)#6,797 |
| 64. | Landess | $1,311 | $979(+332)#64 | $1,276(+35.0)#6,807 |
| 65. | Georgetown | $1,302 | $979(+323)#65 | $1,276(+26.0)#6,907 |
| 66. | Granger | $1,301 | $979(+322)#66 | $1,276(+25.0)#6,914 |
| 67. | Johnson | $1,296 | $979(+317)#67 | $1,276(+20.0)#6,963 |
| 68. | Jimmerson Lake | $1,278 | $979(+299)#68 | $1,276(+2.00)#7,157 |
| 69. | Battle Ground | $1,268 | $979(+289)#69 | $1,276(-8.00)#7,282 |
| 70. | Smithville Sanders | $1,262 | $979(+283)#70 | $1,276(-14.0)#7,338 |
| 71. | Bright | $1,254 | $979(+275)#71 | $1,276(-22.0)#7,426 |
| 72. | Monrovia | $1,242 | $979(+263)#72 | $1,276(-34.0)#7,581 |
| 73. | Marion | $1,239 | $979(+260)#73 | $1,276(-37.0)#7,617 |
| 74. | Lowell | $1,236 | $979(+257)#74 | $1,276(-40.0)#7,648 |
| 75. | Memphis | $1,233 | $979(+254)#75 | $1,276(-43.0)#7,683 |
| 76. | Pittsboro | $1,229 | $979(+250)#76 | $1,276(-47.0)#7,732 |
| 77. | Schererville | $1,222 | $979(+243)#77 | $1,276(-54.0)#7,825 |
| 78. | Lizton | $1,220 | $979(+241)#78 | $1,276(-56.0)#7,860 |
| 79. | Danville | $1,219 | $979(+240)#79 | $1,276(-57.0)#7,864 |
| 80. | Kouts | $1,218 | $979(+239)#80 | $1,276(-58.0)#7,886 |
| 81. | Dyer | $1,213 | $979(+234)#81 | $1,276(-63.0)#7,942 |
| 82. | Harrison Lake | $1,213 | $979(+234)#82 | $1,276(-63.0)#7,954 |
| 83. | Cedar Lake | $1,205 | $979(+226)#83 | $1,276(-71.0)#8,033 |
| 84. | Heritage Lake | $1,205 | $979(+226)#84 | $1,276(-71.0)#8,038 |
| 85. | Cordry Sweetwater Lakes | $1,204 | $979(+225)#85 | $1,276(-72.0)#8,046 |
| 86. | Chesterton | $1,203 | $979(+224)#86 | $1,276(-73.0)#8,053 |
| 87. | Metamora | $1,202 | $979(+223)#87 | $1,276(-74.0)#8,080 |
| 88. | Blooming Grove | $1,198 | $979(+219)#88 | $1,276(-78.0)#8,144 |
| 89. | Santa Claus | $1,197 | $979(+218)#89 | $1,276(-79.0)#8,154 |
| 90. | Carrollton | $1,197 | $979(+218)#90 | $1,276(-79.0)#8,158 |
| 91. | Plainfield | $1,195 | $979(+216)#91 | $1,276(-81.0)#8,172 |
| 92. | Royerton | $1,193 | $979(+214)#92 | $1,276(-83.0)#8,214 |
| 93. | Fair Oaks | $1,184 | $979(+205)#93 | $1,276(-92.0)#8,322 |
| 94. | Michiana Shores | $1,181 | $979(+202)#94 | $1,276(-95.0)#8,365 |
| 95. | Fortville | $1,179 | $979(+200)#95 | $1,276(-97.0)#8,381 |
| 96. | Trafalgar | $1,178 | $979(+199)#96 | $1,276(-98.0)#8,400 |
| 97. | Pottawattamie Park | $1,177 | $979(+198)#97 | $1,276(-99.0)#8,413 |
| 98. | Willow Branch | $1,174 | $979(+195)#98 | $1,276(-102)#8,458 |
| 99. | North Salem | $1,172 | $979(+193)#99 | $1,276(-104)#8,484 |
| 100. | Merrillville | $1,169 | $979(+190)#100 | $1,276(-107)#8,516 |
Common Questions
What are the Top 10 Cities with the Highest Median Costs of Housing in Indiana?
Top 10 Cities with the Highest Median Costs of Housing in Indiana are:
#1
$4,001
#2
$3,438
#3
$2,375
#4
$2,375
#5
$2,344
#6
$2,280
#7
$2,233
#8
$2,214
#9
$1,906
#10
$1,901
What city has the Highest Median Costs of Housing in Indiana?
North Crows Nest has the Highest Median Costs of Housing in Indiana with $4,001.
What is the Median Housing Costs in the State of Indiana?
Median Housing Costs in Indiana is $979.
What is the Median Housing Costs in the United States?
Median Housing Costs in the United States is $1,276.