Zip Codes with the Highest Percentage of Population with a Degree in Arts and Humanities in Washington
RELATED REPORTS & OPTIONS
Arts and Humanities
Washington
Compare Zip Codes
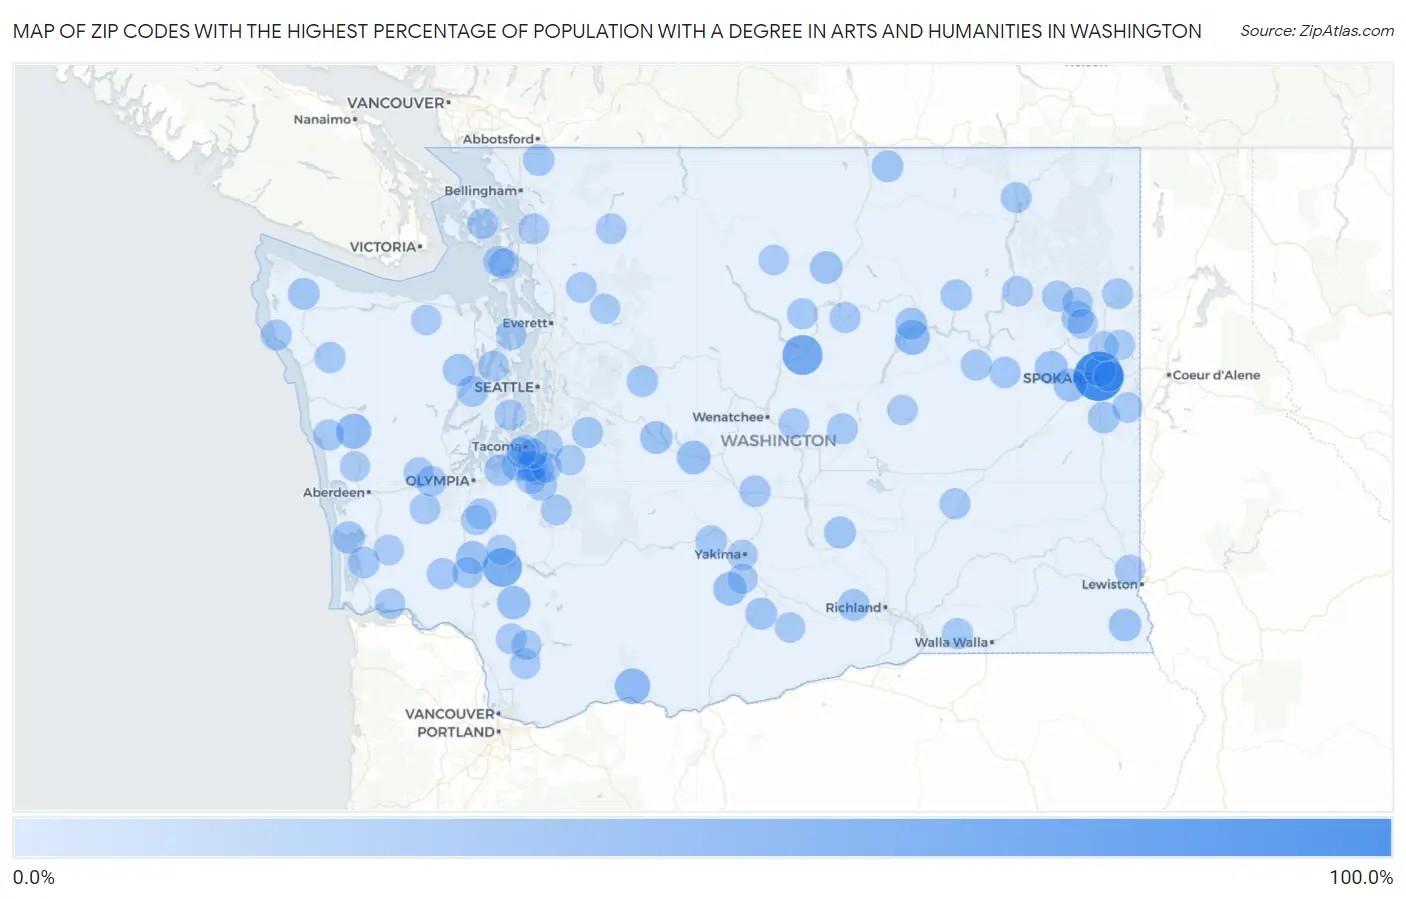
Map of Zip Codes with the Highest Percentage of Population with a Degree in Arts and Humanities in Washington
0.0%
100.0%
Zip Codes with the Highest Percentage of Population with a Degree in Arts and Humanities in Washington
| Zip Code | % Graduates | vs State | vs National | |
| 1. | 99258 | 100.0% | 5.2%(+94.8)#1 | 6.0%(+94.0)#19 |
| 2. | 98817 | 54.1% | 5.2%(+48.8)#2 | 6.0%(+48.1)#183 |
| 3. | 98582 | 50.0% | 5.2%(+44.8)#3 | 6.0%(+44.0)#224 |
| 4. | 98623 | 33.3% | 5.2%(+28.1)#4 | 6.0%(+27.3)#539 |
| 5. | 98552 | 30.6% | 5.2%(+25.3)#5 | 6.0%(+24.6)#639 |
| 6. | 99123 | 29.5% | 5.2%(+24.3)#6 | 6.0%(+23.5)#681 |
| 7. | 98943 | 25.0% | 5.2%(+19.8)#7 | 6.0%(+19.0)#955 |
| 8. | 98649 | 24.0% | 5.2%(+18.8)#8 | 6.0%(+18.0)#1,033 |
| 9. | 98933 | 23.6% | 5.2%(+18.4)#9 | 6.0%(+17.6)#1,064 |
| 10. | 99011 | 21.6% | 5.2%(+16.4)#10 | 6.0%(+15.6)#1,272 |
| 11. | 99029 | 21.3% | 5.2%(+16.0)#11 | 6.0%(+15.3)#1,322 |
| 12. | 98565 | 21.2% | 5.2%(+16.0)#12 | 6.0%(+15.2)#1,329 |
| 13. | 98925 | 20.7% | 5.2%(+15.5)#13 | 6.0%(+14.7)#1,389 |
| 14. | 98829 | 20.0% | 5.2%(+14.8)#14 | 6.0%(+14.0)#1,484 |
| 15. | 99402 | 19.7% | 5.2%(+14.5)#15 | 6.0%(+13.7)#1,542 |
| 16. | 98590 | 18.4% | 5.2%(+13.2)#16 | 6.0%(+12.4)#1,750 |
| 17. | 99110 | 18.1% | 5.2%(+12.8)#17 | 6.0%(+12.1)#1,834 |
| 18. | 99133 | 17.3% | 5.2%(+12.1)#18 | 6.0%(+11.3)#2,018 |
| 19. | 99349 | 17.1% | 5.2%(+11.9)#19 | 6.0%(+11.2)#2,047 |
| 20. | 98326 | 16.8% | 5.2%(+11.6)#20 | 6.0%(+10.8)#2,113 |
| 21. | 98948 | 16.8% | 5.2%(+11.6)#21 | 6.0%(+10.8)#2,121 |
| 22. | 98320 | 16.6% | 5.2%(+11.4)#22 | 6.0%(+10.6)#2,193 |
| 23. | 98844 | 16.1% | 5.2%(+10.9)#23 | 6.0%(+10.1)#2,303 |
| 24. | 98439 | 16.0% | 5.2%(+10.8)#24 | 6.0%(+9.98)#2,353 |
| 25. | 99031 | 15.9% | 5.2%(+10.7)#25 | 6.0%(+9.88)#2,378 |
| 26. | 99320 | 15.9% | 5.2%(+10.6)#26 | 6.0%(+9.86)#2,383 |
| 27. | 98947 | 15.4% | 5.2%(+10.2)#27 | 6.0%(+9.37)#2,546 |
| 28. | 98338 | 15.3% | 5.2%(+10.1)#28 | 6.0%(+9.33)#2,552 |
| 29. | 98586 | 15.1% | 5.2%(+9.88)#29 | 6.0%(+9.10)#2,638 |
| 30. | 98934 | 14.8% | 5.2%(+9.59)#30 | 6.0%(+8.81)#2,757 |
| 31. | 98276 | 14.8% | 5.2%(+9.55)#31 | 6.0%(+8.76)#2,776 |
| 32. | 98327 | 14.8% | 5.2%(+9.54)#32 | 6.0%(+8.76)#2,783 |
| 33. | 99122 | 14.7% | 5.2%(+9.46)#33 | 6.0%(+8.68)#2,804 |
| 34. | 98288 | 14.5% | 5.2%(+9.33)#34 | 6.0%(+8.55)#2,864 |
| 35. | 98380 | 14.3% | 5.2%(+9.08)#35 | 6.0%(+8.30)#2,964 |
| 36. | 99140 | 14.0% | 5.2%(+8.74)#36 | 6.0%(+7.96)#3,153 |
| 37. | 98538 | 13.9% | 5.2%(+8.68)#37 | 6.0%(+7.89)#3,177 |
| 38. | 99117 | 13.8% | 5.2%(+8.62)#38 | 6.0%(+7.83)#3,211 |
| 39. | 99207 | 13.8% | 5.2%(+8.58)#39 | 6.0%(+7.79)#3,231 |
| 40. | 98596 | 13.6% | 5.2%(+8.42)#40 | 6.0%(+7.64)#3,291 |
| 41. | 98331 | 13.3% | 5.2%(+8.10)#41 | 6.0%(+7.32)#3,466 |
| 42. | 98587 | 13.0% | 5.2%(+7.83)#42 | 6.0%(+7.05)#3,615 |
| 43. | 98813 | 13.0% | 5.2%(+7.75)#43 | 6.0%(+6.97)#3,664 |
| 44. | 98051 | 13.0% | 5.2%(+7.74)#44 | 6.0%(+6.96)#3,672 |
| 45. | 99341 | 12.8% | 5.2%(+7.56)#45 | 6.0%(+6.78)#3,786 |
| 46. | 98823 | 12.6% | 5.2%(+7.36)#46 | 6.0%(+6.58)#3,902 |
| 47. | 99360 | 12.6% | 5.2%(+7.36)#47 | 6.0%(+6.58)#3,904 |
| 48. | 99181 | 12.5% | 5.2%(+7.29)#48 | 6.0%(+6.50)#3,948 |
| 49. | 98350 | 12.5% | 5.2%(+7.29)#49 | 6.0%(+6.50)#3,975 |
| 50. | 98846 | 12.3% | 5.2%(+7.06)#50 | 6.0%(+6.27)#4,131 |
| 51. | 99156 | 12.2% | 5.2%(+6.96)#51 | 6.0%(+6.18)#4,196 |
| 52. | 98359 | 12.1% | 5.2%(+6.89)#52 | 6.0%(+6.10)#4,246 |
| 53. | 99141 | 12.0% | 5.2%(+6.83)#53 | 6.0%(+6.05)#4,285 |
| 54. | 98315 | 11.9% | 5.2%(+6.74)#54 | 6.0%(+5.95)#4,343 |
| 55. | 98589 | 11.8% | 5.2%(+6.56)#55 | 6.0%(+5.77)#4,468 |
| 56. | 98568 | 11.8% | 5.2%(+6.55)#56 | 6.0%(+5.77)#4,473 |
| 57. | 98278 | 11.8% | 5.2%(+6.55)#57 | 6.0%(+5.77)#4,474 |
| 58. | 98233 | 11.6% | 5.2%(+6.39)#58 | 6.0%(+5.61)#4,608 |
| 59. | 98047 | 11.5% | 5.2%(+6.30)#59 | 6.0%(+5.51)#4,679 |
| 60. | 98625 | 11.5% | 5.2%(+6.29)#60 | 6.0%(+5.51)#4,681 |
| 61. | 98557 | 11.4% | 5.2%(+6.18)#61 | 6.0%(+5.40)#4,781 |
| 62. | 98445 | 11.2% | 5.2%(+5.97)#62 | 6.0%(+5.19)#4,962 |
| 63. | 98375 | 11.1% | 5.2%(+5.92)#63 | 6.0%(+5.14)#4,996 |
| 64. | 98446 | 11.1% | 5.2%(+5.90)#64 | 6.0%(+5.12)#5,006 |
| 65. | 98277 | 11.0% | 5.2%(+5.83)#65 | 6.0%(+5.05)#5,110 |
| 66. | 99137 | 11.0% | 5.2%(+5.79)#66 | 6.0%(+5.00)#5,138 |
| 67. | 98328 | 11.0% | 5.2%(+5.74)#67 | 6.0%(+4.96)#5,171 |
| 68. | 98850 | 10.9% | 5.2%(+5.72)#68 | 6.0%(+4.94)#5,185 |
| 69. | 98222 | 10.9% | 5.2%(+5.72)#69 | 6.0%(+4.94)#5,190 |
| 70. | 99179 | 10.8% | 5.2%(+5.62)#70 | 6.0%(+4.83)#5,287 |
| 71. | 98237 | 10.7% | 5.2%(+5.47)#71 | 6.0%(+4.69)#5,438 |
| 72. | 98601 | 10.7% | 5.2%(+5.45)#72 | 6.0%(+4.67)#5,472 |
| 73. | 99212 | 10.6% | 5.2%(+5.44)#73 | 6.0%(+4.65)#5,484 |
| 74. | 99030 | 10.6% | 5.2%(+5.43)#74 | 6.0%(+4.64)#5,495 |
| 75. | 98387 | 10.6% | 5.2%(+5.36)#75 | 6.0%(+4.58)#5,564 |
| 76. | 98223 | 10.3% | 5.2%(+5.13)#76 | 6.0%(+4.34)#5,825 |
| 77. | 98374 | 10.3% | 5.2%(+5.11)#77 | 6.0%(+4.32)#5,851 |
| 78. | 98935 | 10.3% | 5.2%(+5.09)#78 | 6.0%(+4.31)#5,868 |
| 79. | 98418 | 10.3% | 5.2%(+5.04)#79 | 6.0%(+4.25)#5,930 |
| 80. | 98860 | 10.2% | 5.2%(+4.99)#80 | 6.0%(+4.21)#5,978 |
| 81. | 98856 | 10.2% | 5.2%(+4.95)#81 | 6.0%(+4.17)#6,032 |
| 82. | 98577 | 10.2% | 5.2%(+4.94)#82 | 6.0%(+4.16)#6,051 |
| 83. | 98902 | 10.1% | 5.2%(+4.94)#83 | 6.0%(+4.15)#6,057 |
| 84. | 98951 | 10.1% | 5.2%(+4.92)#84 | 6.0%(+4.14)#6,074 |
| 85. | 98321 | 10.0% | 5.2%(+4.83)#85 | 6.0%(+4.05)#6,175 |
| 86. | 98570 | 10.0% | 5.2%(+4.79)#86 | 6.0%(+4.00)#6,224 |
| 87. | 98530 | 10.0% | 5.2%(+4.79)#87 | 6.0%(+4.00)#6,250 |
| 88. | 98443 | 10.0% | 5.2%(+4.77)#88 | 6.0%(+3.98)#6,288 |
| 89. | 98362 | 9.8% | 5.2%(+4.61)#89 | 6.0%(+3.83)#6,488 |
| 90. | 98643 | 9.8% | 5.2%(+4.54)#90 | 6.0%(+3.76)#6,581 |
| 91. | 98409 | 9.7% | 5.2%(+4.50)#91 | 6.0%(+3.72)#6,636 |
| 92. | 99148 | 9.7% | 5.2%(+4.46)#92 | 6.0%(+3.68)#6,686 |
| 93. | 99021 | 9.6% | 5.2%(+4.36)#93 | 6.0%(+3.58)#6,818 |
| 94. | 98541 | 9.5% | 5.2%(+4.33)#94 | 6.0%(+3.55)#6,866 |
| 95. | 98252 | 9.5% | 5.2%(+4.25)#95 | 6.0%(+3.47)#6,986 |
| 96. | 98603 | 9.4% | 5.2%(+4.24)#96 | 6.0%(+3.45)#7,009 |
| 97. | 99005 | 9.4% | 5.2%(+4.23)#97 | 6.0%(+3.45)#7,017 |
| 98. | 99006 | 9.4% | 5.2%(+4.15)#98 | 6.0%(+3.37)#7,151 |
| 99. | 98550 | 9.3% | 5.2%(+4.12)#99 | 6.0%(+3.34)#7,190 |
| 100. | 98340 | 9.3% | 5.2%(+4.10)#100 | 6.0%(+3.32)#7,217 |
Common Questions
What are the Top 10 Zip Codes with the Highest Percentage of Population with a Degree in Arts and Humanities in Washington?
Top 10 Zip Codes with the Highest Percentage of Population with a Degree in Arts and Humanities in Washington are:
What zip code has the Highest Percentage of Population with a Degree in Arts and Humanities in Washington?
99258 has the Highest Percentage of Population with a Degree in Arts and Humanities in Washington with 100.0%.
What is the Percentage of Population with a Degree in Arts and Humanities in the State of Washington?
Percentage of Population with a Degree in Arts and Humanities in Washington is 5.2%.
What is the Percentage of Population with a Degree in Arts and Humanities in the United States?
Percentage of Population with a Degree in Arts and Humanities in the United States is 6.0%.