Cities with the Highest Percentage of Jamaican Population in Michigan
RELATED REPORTS & OPTIONS
Jamaican
Michigan
Compare Cities
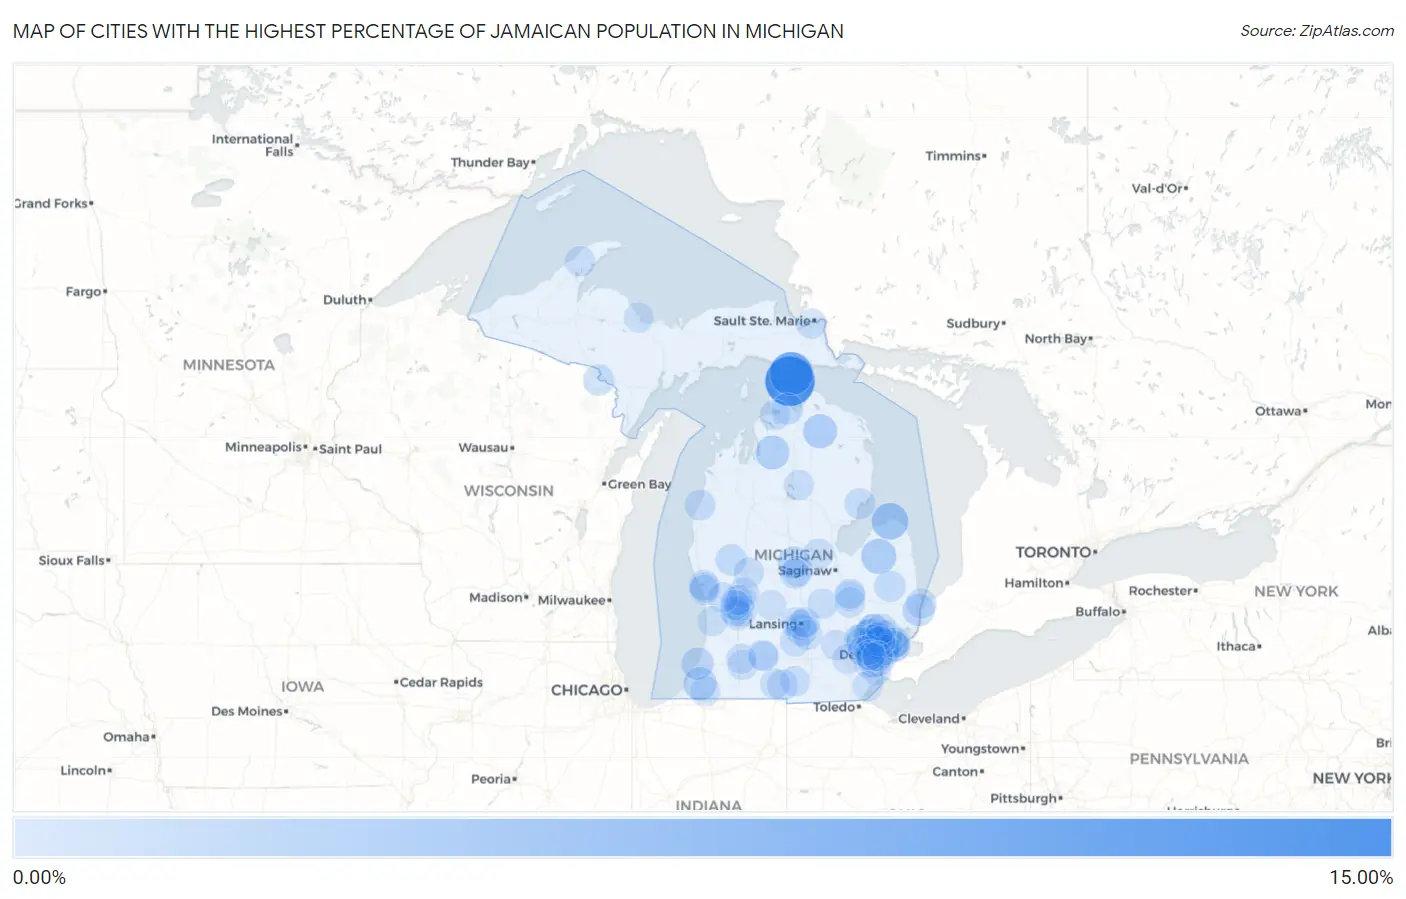
Map of Cities with the Highest Percentage of Jamaican Population in Michigan
0.00%
15.00%
Cities with the Highest Percentage of Jamaican Population in Michigan
| City | Jamaican | vs State | vs National | |
| 1. | Mackinaw City | 13.13% | 0.098%(+13.0)#1 | 0.36%(+12.8)#19 |
| 2. | St Ignace | 8.78% | 0.098%(+8.68)#2 | 0.36%(+8.41)#44 |
| 3. | Port Austin | 4.20% | 0.098%(+4.10)#3 | 0.36%(+3.83)#145 |
| 4. | Cass City | 3.17% | 0.098%(+3.07)#4 | 0.36%(+2.80)#215 |
| 5. | Canada Creek Ranch | 2.55% | 0.098%(+2.45)#5 | 0.36%(+2.18)#291 |
| 6. | Mancelona | 2.40% | 0.098%(+2.31)#6 | 0.36%(+2.04)#312 |
| 7. | Berrien Springs | 1.98% | 0.098%(+1.88)#7 | 0.36%(+1.61)#403 |
| 8. | Lake Michigan Beach | 1.42% | 0.098%(+1.32)#8 | 0.36%(+1.05)#587 |
| 9. | Shepherd | 1.34% | 0.098%(+1.25)#9 | 0.36%(+0.979)#619 |
| 10. | Marysville | 1.33% | 0.098%(+1.24)#10 | 0.36%(+0.970)#624 |
| 11. | Beverly Hills | 1.24% | 0.098%(+1.14)#11 | 0.36%(+0.878)#687 |
| 12. | Holt | 0.99% | 0.098%(+0.888)#12 | 0.36%(+0.622)#871 |
| 13. | Harper Woods | 0.87% | 0.098%(+0.772)#13 | 0.36%(+0.506)#975 |
| 14. | Walled Lake | 0.85% | 0.098%(+0.756)#14 | 0.36%(+0.490)#994 |
| 15. | Alanson | 0.81% | 0.098%(+0.714)#15 | 0.36%(+0.448)#1,039 |
| 16. | Pontiac | 0.78% | 0.098%(+0.682)#16 | 0.36%(+0.416)#1,079 |
| 17. | White Cloud | 0.75% | 0.098%(+0.654)#17 | 0.36%(+0.388)#1,119 |
| 18. | Orchard Lake Village | 0.73% | 0.098%(+0.628)#18 | 0.36%(+0.362)#1,149 |
| 19. | Brown City | 0.71% | 0.098%(+0.610)#19 | 0.36%(+0.344)#1,179 |
| 20. | Kingsford | 0.70% | 0.098%(+0.604)#20 | 0.36%(+0.339)#1,185 |
| 21. | Southfield | 0.70% | 0.098%(+0.603)#21 | 0.36%(+0.337)#1,190 |
| 22. | Oak Park | 0.67% | 0.098%(+0.574)#22 | 0.36%(+0.308)#1,231 |
| 23. | Lathrup Village | 0.61% | 0.098%(+0.516)#23 | 0.36%(+0.250)#1,324 |
| 24. | Eastpointe | 0.53% | 0.098%(+0.436)#24 | 0.36%(+0.170)#1,462 |
| 25. | Tawas City | 0.51% | 0.098%(+0.417)#25 | 0.36%(+0.151)#1,495 |
| 26. | Highland Park | 0.51% | 0.098%(+0.412)#26 | 0.36%(+0.146)#1,507 |
| 27. | Keego Harbor | 0.43% | 0.098%(+0.335)#27 | 0.36%(+0.069)#1,663 |
| 28. | Manistee | 0.43% | 0.098%(+0.334)#28 | 0.36%(+0.069)#1,669 |
| 29. | Petoskey | 0.39% | 0.098%(+0.295)#29 | 0.36%(+0.029)#1,767 |
| 30. | Quincy | 0.38% | 0.098%(+0.286)#30 | 0.36%(+0.020)#1,792 |
| 31. | Kentwood | 0.37% | 0.098%(+0.272)#31 | 0.36%(+0.006)#1,837 |
| 32. | St Louis | 0.35% | 0.098%(+0.249)#32 | 0.36%(-0.017)#1,916 |
| 33. | Pinckney | 0.31% | 0.098%(+0.210)#33 | 0.36%(-0.056)#2,041 |
| 34. | Laurium | 0.30% | 0.098%(+0.202)#34 | 0.36%(-0.064)#2,072 |
| 35. | Muskegon | 0.27% | 0.098%(+0.174)#35 | 0.36%(-0.092)#2,197 |
| 36. | Springfield | 0.27% | 0.098%(+0.168)#36 | 0.36%(-0.098)#2,227 |
| 37. | Bingham Farms | 0.25% | 0.098%(+0.149)#37 | 0.36%(-0.117)#2,299 |
| 38. | Northview | 0.24% | 0.098%(+0.142)#38 | 0.36%(-0.124)#2,328 |
| 39. | Detroit | 0.24% | 0.098%(+0.141)#39 | 0.36%(-0.125)#2,339 |
| 40. | Lansing | 0.23% | 0.098%(+0.128)#40 | 0.36%(-0.138)#2,414 |
| 41. | Jonesville | 0.22% | 0.098%(+0.119)#41 | 0.36%(-0.147)#2,464 |
| 42. | Romulus | 0.21% | 0.098%(+0.110)#42 | 0.36%(-0.156)#2,504 |
| 43. | Grand Rapids | 0.19% | 0.098%(+0.097)#43 | 0.36%(-0.169)#2,563 |
| 44. | Franklin | 0.19% | 0.098%(+0.091)#44 | 0.36%(-0.175)#2,600 |
| 45. | Waverly | 0.18% | 0.098%(+0.084)#45 | 0.36%(-0.182)#2,643 |
| 46. | Roscommon | 0.18% | 0.098%(+0.080)#46 | 0.36%(-0.185)#2,668 |
| 47. | Eaton Rapids | 0.17% | 0.098%(+0.075)#47 | 0.36%(-0.191)#2,693 |
| 48. | Sault Ste Marie | 0.17% | 0.098%(+0.074)#48 | 0.36%(-0.192)#2,704 |
| 49. | Cutlerville | 0.17% | 0.098%(+0.073)#49 | 0.36%(-0.192)#2,710 |
| 50. | Howard City | 0.16% | 0.098%(+0.066)#50 | 0.36%(-0.200)#2,751 |
| 51. | Rockford | 0.16% | 0.098%(+0.065)#51 | 0.36%(-0.201)#2,758 |
| 52. | Farmington Hills | 0.16% | 0.098%(+0.059)#52 | 0.36%(-0.207)#2,796 |
| 53. | Port Huron | 0.16% | 0.098%(+0.058)#53 | 0.36%(-0.208)#2,804 |
| 54. | Wixom | 0.15% | 0.098%(+0.055)#54 | 0.36%(-0.211)#2,821 |
| 55. | Taylor | 0.15% | 0.098%(+0.053)#55 | 0.36%(-0.213)#2,831 |
| 56. | Midland | 0.15% | 0.098%(+0.051)#56 | 0.36%(-0.215)#2,849 |
| 57. | Woodhaven | 0.15% | 0.098%(+0.050)#57 | 0.36%(-0.216)#2,857 |
| 58. | Westland | 0.13% | 0.098%(+0.028)#58 | 0.36%(-0.237)#3,016 |
| 59. | Owosso | 0.12% | 0.098%(+0.025)#59 | 0.36%(-0.241)#3,036 |
| 60. | Auburn Hills | 0.12% | 0.098%(+0.020)#60 | 0.36%(-0.246)#3,073 |
| 61. | Warren | 0.11% | 0.098%(+0.012)#61 | 0.36%(-0.254)#3,149 |
| 62. | Wyoming | 0.11% | 0.098%(+0.012)#62 | 0.36%(-0.254)#3,150 |
| 63. | Niles | 0.10% | 0.098%(+0.003)#63 | 0.36%(-0.263)#3,223 |
| 64. | Sterling Heights | 0.10% | 0.098%(+0.003)#64 | 0.36%(-0.263)#3,228 |
| 65. | Novi | 0.099% | 0.098%(+0.001)#65 | 0.36%(-0.265)#3,249 |
| 66. | Grosse Pointe Woods | 0.098% | 0.098%(+0.000)#66 | 0.36%(-0.266)#3,255 |
| 67. | Troy | 0.098% | 0.098%(-0.000)#67 | 0.36%(-0.266)#3,260 |
| 68. | Mason | 0.097% | 0.098%(-0.001)#68 | 0.36%(-0.267)#3,267 |
| 69. | Comstock Park | 0.096% | 0.098%(-0.001)#69 | 0.36%(-0.267)#3,271 |
| 70. | Hamtramck | 0.079% | 0.098%(-0.019)#70 | 0.36%(-0.285)#3,401 |
| 71. | Ann Arbor | 0.077% | 0.098%(-0.021)#71 | 0.36%(-0.287)#3,427 |
| 72. | Flint | 0.076% | 0.098%(-0.022)#72 | 0.36%(-0.288)#3,440 |
| 73. | Lincoln Park | 0.075% | 0.098%(-0.022)#73 | 0.36%(-0.288)#3,444 |
| 74. | Plymouth | 0.075% | 0.098%(-0.022)#74 | 0.36%(-0.288)#3,448 |
| 75. | Norton Shores | 0.072% | 0.098%(-0.026)#75 | 0.36%(-0.292)#3,486 |
| 76. | Portage | 0.065% | 0.098%(-0.032)#76 | 0.36%(-0.298)#3,534 |
| 77. | St Clair Shores | 0.065% | 0.098%(-0.033)#77 | 0.36%(-0.299)#3,543 |
| 78. | Muskegon Heights | 0.060% | 0.098%(-0.037)#78 | 0.36%(-0.303)#3,592 |
| 79. | Alma | 0.053% | 0.098%(-0.045)#79 | 0.36%(-0.311)#3,672 |
| 80. | Coldwater | 0.051% | 0.098%(-0.047)#80 | 0.36%(-0.313)#3,687 |
| 81. | Walker | 0.044% | 0.098%(-0.054)#81 | 0.36%(-0.320)#3,767 |
| 82. | Livonia | 0.037% | 0.098%(-0.061)#82 | 0.36%(-0.327)#3,844 |
| 83. | Birmingham | 0.037% | 0.098%(-0.061)#83 | 0.36%(-0.327)#3,846 |
| 84. | East Lansing | 0.035% | 0.098%(-0.062)#84 | 0.36%(-0.328)#3,866 |
| 85. | Beecher | 0.033% | 0.098%(-0.065)#85 | 0.36%(-0.331)#3,888 |
| 86. | Mount Morris | 0.032% | 0.098%(-0.066)#86 | 0.36%(-0.332)#3,901 |
| 87. | Marquette | 0.024% | 0.098%(-0.073)#87 | 0.36%(-0.339)#3,967 |
| 88. | Ionia | 0.023% | 0.098%(-0.075)#88 | 0.36%(-0.341)#3,975 |
| 89. | Royal Oak | 0.022% | 0.098%(-0.075)#89 | 0.36%(-0.341)#3,984 |
| 90. | Coopersville | 0.021% | 0.098%(-0.077)#90 | 0.36%(-0.343)#3,997 |
| 91. | Inkster | 0.019% | 0.098%(-0.078)#91 | 0.36%(-0.344)#4,018 |
| 92. | Kalamazoo | 0.019% | 0.098%(-0.079)#92 | 0.36%(-0.345)#4,022 |
| 93. | Battle Creek | 0.013% | 0.098%(-0.084)#93 | 0.36%(-0.350)#4,087 |
| 94. | Rochester Hills | 0.011% | 0.098%(-0.087)#94 | 0.36%(-0.353)#4,109 |
| 95. | Holland | 0.0088% | 0.098%(-0.089)#95 | 0.36%(-0.355)#4,120 |
| 96. | Garden City | 0.0074% | 0.098%(-0.090)#96 | 0.36%(-0.356)#4,125 |
| 97. | Dearborn | 0.0065% | 0.098%(-0.091)#97 | 0.36%(-0.357)#4,130 |
| 98. | Monroe | 0.0049% | 0.098%(-0.093)#98 | 0.36%(-0.359)#4,136 |
Common Questions
What are the Top 10 Cities with the Highest Percentage of Jamaican Population in Michigan?
Top 10 Cities with the Highest Percentage of Jamaican Population in Michigan are:
#1
13.13%
#2
8.78%
#3
4.20%
#4
3.17%
#5
2.55%
#6
2.40%
#7
1.98%
#8
1.42%
#9
1.34%
#10
1.33%
What city has the Highest Percentage of Jamaican Population in Michigan?
Mackinaw City has the Highest Percentage of Jamaican Population in Michigan with 13.13%.
What is the Percentage of Jamaican Population in the State of Michigan?
Percentage of Jamaican Population in Michigan is 0.098%.
What is the Percentage of Jamaican Population in the United States?
Percentage of Jamaican Population in the United States is 0.36%.