Cities with the Highest Percentage of Jamaican Population in Missouri
RELATED REPORTS & OPTIONS
Jamaican
Missouri
Compare Cities
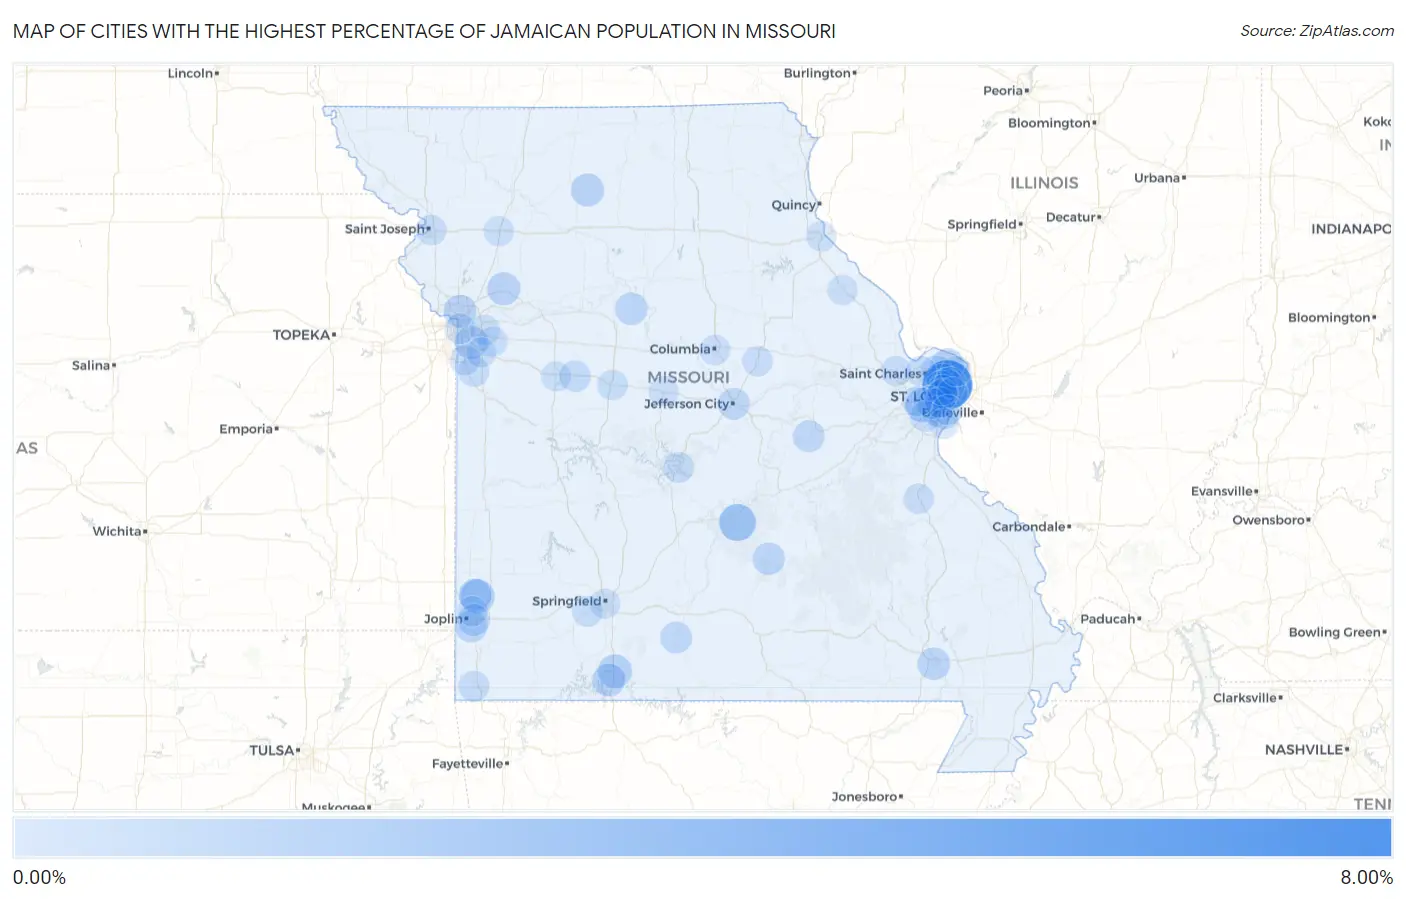
Map of Cities with the Highest Percentage of Jamaican Population in Missouri
0.00%
8.00%
Cities with the Highest Percentage of Jamaican Population in Missouri
| City | Jamaican | vs State | vs National | |
| 1. | Northwoods | 6.11% | 0.068%(+6.04)#1 | 0.36%(+5.74)#90 |
| 2. | Fort Leonard Wood | 2.06% | 0.068%(+1.99)#2 | 0.36%(+1.69)#374 |
| 3. | Twin Oaks | 1.29% | 0.068%(+1.22)#3 | 0.36%(+0.929)#650 |
| 4. | Alba | 1.25% | 0.068%(+1.18)#4 | 0.36%(+0.885)#680 |
| 5. | Bull Creek | 1.06% | 0.068%(+0.990)#5 | 0.36%(+0.695)#816 |
| 6. | Raytown | 0.90% | 0.068%(+0.832)#6 | 0.36%(+0.537)#943 |
| 7. | Old Jamestown | 0.89% | 0.068%(+0.824)#7 | 0.36%(+0.529)#950 |
| 8. | Crystal Lakes | 0.88% | 0.068%(+0.809)#8 | 0.36%(+0.514)#966 |
| 9. | Laredo | 0.86% | 0.068%(+0.794)#9 | 0.36%(+0.498)#982 |
| 10. | Branson | 0.81% | 0.068%(+0.746)#10 | 0.36%(+0.451)#1,037 |
| 11. | Oakwood Park | 0.80% | 0.068%(+0.728)#11 | 0.36%(+0.433)#1,060 |
| 12. | Purcell | 0.72% | 0.068%(+0.656)#12 | 0.36%(+0.361)#1,153 |
| 13. | Slater | 0.70% | 0.068%(+0.636)#13 | 0.36%(+0.341)#1,183 |
| 14. | Poplar Bluff | 0.69% | 0.068%(+0.624)#14 | 0.36%(+0.329)#1,203 |
| 15. | Kinloch | 0.69% | 0.068%(+0.619)#15 | 0.36%(+0.324)#1,209 |
| 16. | Saginaw | 0.66% | 0.068%(+0.587)#16 | 0.36%(+0.292)#1,259 |
| 17. | Licking | 0.65% | 0.068%(+0.578)#17 | 0.36%(+0.283)#1,272 |
| 18. | Duquesne | 0.57% | 0.068%(+0.498)#18 | 0.36%(+0.202)#1,404 |
| 19. | Jefferson City | 0.52% | 0.068%(+0.455)#19 | 0.36%(+0.159)#1,481 |
| 20. | Ava | 0.51% | 0.068%(+0.443)#20 | 0.36%(+0.148)#1,503 |
| 21. | Owensville | 0.50% | 0.068%(+0.432)#21 | 0.36%(+0.136)#1,523 |
| 22. | Brentwood | 0.45% | 0.068%(+0.384)#22 | 0.36%(+0.089)#1,615 |
| 23. | Pine Lawn | 0.43% | 0.068%(+0.365)#23 | 0.36%(+0.069)#1,665 |
| 24. | Hazelwood | 0.43% | 0.068%(+0.362)#24 | 0.36%(+0.066)#1,680 |
| 25. | Knob Noster | 0.36% | 0.068%(+0.290)#25 | 0.36%(-0.006)#1,880 |
| 26. | Normandy | 0.33% | 0.068%(+0.257)#26 | 0.36%(-0.038)#1,987 |
| 27. | Mehlville | 0.27% | 0.068%(+0.203)#27 | 0.36%(-0.092)#2,198 |
| 28. | Vinita Park | 0.27% | 0.068%(+0.201)#28 | 0.36%(-0.094)#2,210 |
| 29. | Raymore | 0.26% | 0.068%(+0.190)#29 | 0.36%(-0.105)#2,258 |
| 30. | Jennings | 0.25% | 0.068%(+0.186)#30 | 0.36%(-0.110)#2,273 |
| 31. | Clayton | 0.24% | 0.068%(+0.170)#31 | 0.36%(-0.125)#2,341 |
| 32. | Lanagan | 0.23% | 0.068%(+0.163)#32 | 0.36%(-0.133)#2,391 |
| 33. | Osage Beach | 0.21% | 0.068%(+0.143)#33 | 0.36%(-0.152)#2,494 |
| 34. | Richmond Heights | 0.20% | 0.068%(+0.128)#34 | 0.36%(-0.168)#2,552 |
| 35. | Republic | 0.18% | 0.068%(+0.112)#35 | 0.36%(-0.183)#2,647 |
| 36. | Des Peres | 0.16% | 0.068%(+0.096)#36 | 0.36%(-0.199)#2,744 |
| 37. | Kansas City | 0.15% | 0.068%(+0.082)#37 | 0.36%(-0.213)#2,833 |
| 38. | Grandview | 0.15% | 0.068%(+0.082)#38 | 0.36%(-0.213)#2,837 |
| 39. | Sedalia | 0.14% | 0.068%(+0.069)#39 | 0.36%(-0.226)#2,925 |
| 40. | Sappington | 0.13% | 0.068%(+0.059)#40 | 0.36%(-0.236)#2,998 |
| 41. | Columbia | 0.12% | 0.068%(+0.049)#41 | 0.36%(-0.246)#3,076 |
| 42. | Kirkwood | 0.11% | 0.068%(+0.041)#42 | 0.36%(-0.254)#3,155 |
| 43. | Webster Groves | 0.11% | 0.068%(+0.041)#43 | 0.36%(-0.255)#3,157 |
| 44. | St Joseph | 0.11% | 0.068%(+0.040)#44 | 0.36%(-0.256)#3,168 |
| 45. | Murphy | 0.11% | 0.068%(+0.038)#45 | 0.36%(-0.257)#3,176 |
| 46. | Fulton | 0.10% | 0.068%(+0.034)#46 | 0.36%(-0.261)#3,208 |
| 47. | Webb City | 0.100% | 0.068%(+0.032)#47 | 0.36%(-0.264)#3,231 |
| 48. | St Charles | 0.099% | 0.068%(+0.031)#48 | 0.36%(-0.265)#3,247 |
| 49. | University City | 0.095% | 0.068%(+0.026)#49 | 0.36%(-0.269)#3,282 |
| 50. | O Fallon | 0.089% | 0.068%(+0.021)#50 | 0.36%(-0.274)#3,324 |
| 51. | Lemay | 0.086% | 0.068%(+0.018)#51 | 0.36%(-0.277)#3,343 |
| 52. | Ballwin | 0.074% | 0.068%(+0.006)#52 | 0.36%(-0.289)#3,458 |
| 53. | Bonne Terre | 0.073% | 0.068%(+0.004)#53 | 0.36%(-0.291)#3,475 |
| 54. | St Louis | 0.064% | 0.068%(-0.004)#54 | 0.36%(-0.299)#3,548 |
| 55. | Cameron | 0.055% | 0.068%(-0.013)#55 | 0.36%(-0.309)#3,656 |
| 56. | Springfield | 0.053% | 0.068%(-0.015)#56 | 0.36%(-0.310)#3,665 |
| 57. | Spanish Lake | 0.050% | 0.068%(-0.019)#57 | 0.36%(-0.314)#3,702 |
| 58. | Bowling Green | 0.048% | 0.068%(-0.020)#58 | 0.36%(-0.315)#3,725 |
| 59. | Hannibal | 0.047% | 0.068%(-0.021)#59 | 0.36%(-0.317)#3,734 |
| 60. | Independence | 0.047% | 0.068%(-0.022)#60 | 0.36%(-0.317)#3,741 |
| 61. | Oakville | 0.045% | 0.068%(-0.023)#61 | 0.36%(-0.318)#3,754 |
| 62. | Tipton | 0.037% | 0.068%(-0.032)#62 | 0.36%(-0.327)#3,852 |
| 63. | Warrensburg | 0.031% | 0.068%(-0.037)#63 | 0.36%(-0.333)#3,907 |
| 64. | Blue Springs | 0.019% | 0.068%(-0.050)#64 | 0.36%(-0.345)#4,027 |
| 65. | Lee S Summit | 0.017% | 0.068%(-0.052)#65 | 0.36%(-0.347)#4,051 |
Common Questions
What are the Top 10 Cities with the Highest Percentage of Jamaican Population in Missouri?
Top 10 Cities with the Highest Percentage of Jamaican Population in Missouri are:
#1
6.11%
#2
2.06%
#3
1.29%
#4
1.25%
#5
1.06%
#6
0.90%
#7
0.89%
#8
0.88%
#9
0.86%
#10
0.81%
What city has the Highest Percentage of Jamaican Population in Missouri?
Northwoods has the Highest Percentage of Jamaican Population in Missouri with 6.11%.
What is the Percentage of Jamaican Population in the State of Missouri?
Percentage of Jamaican Population in Missouri is 0.068%.
What is the Percentage of Jamaican Population in the United States?
Percentage of Jamaican Population in the United States is 0.36%.