Cities with the Highest Percentage of Jamaican Population in Maryland
RELATED REPORTS & OPTIONS
Jamaican
Maryland
Compare Cities
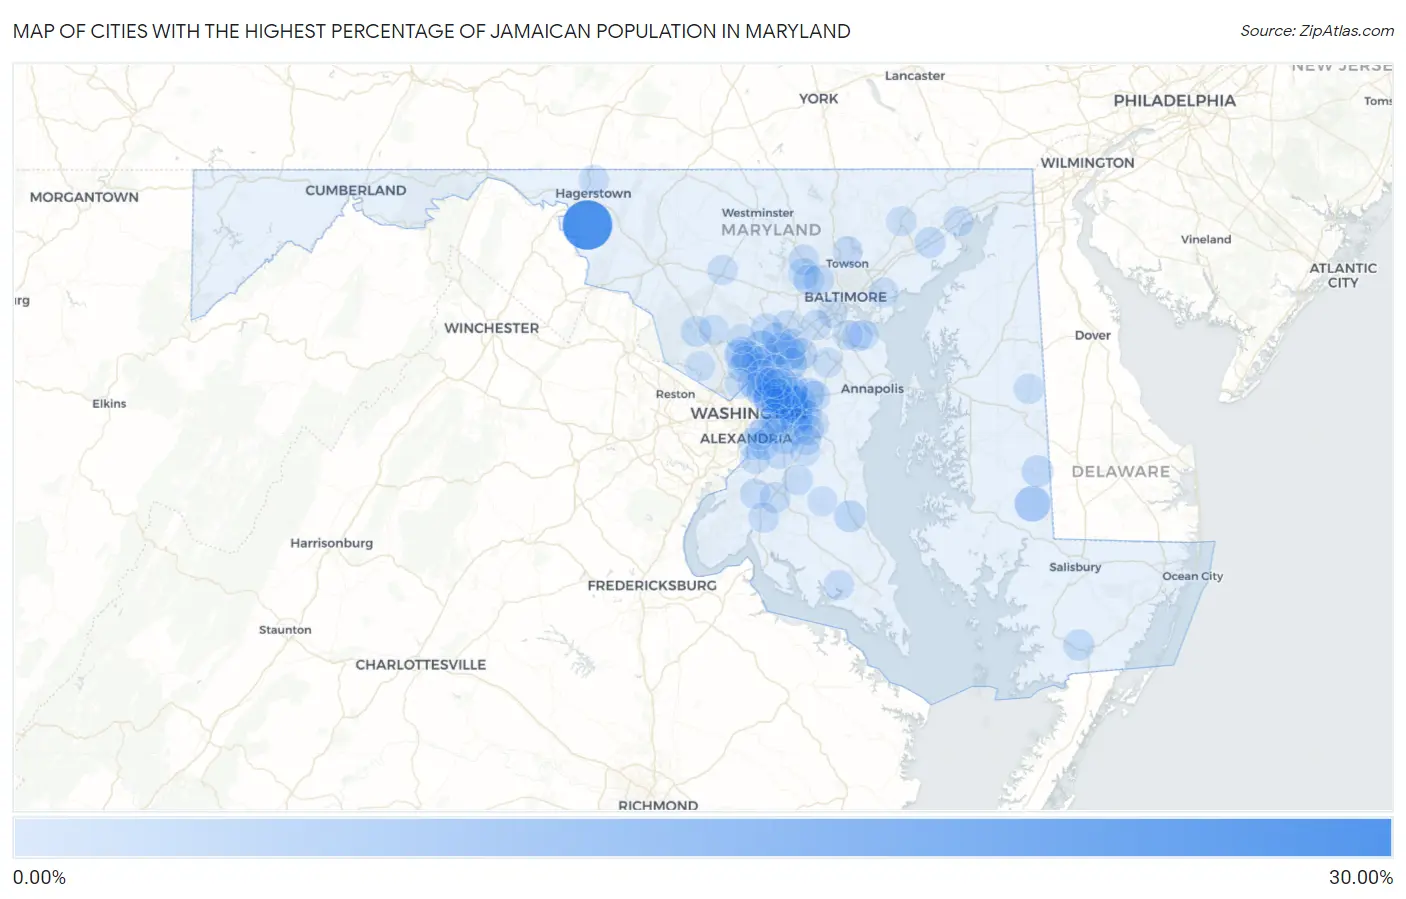
Map of Cities with the Highest Percentage of Jamaican Population in Maryland
0.00%
30.00%
Cities with the Highest Percentage of Jamaican Population in Maryland
| City | Jamaican | vs State | vs National | |
| 1. | Fairplay | 27.26% | 0.75%(+26.5)#1 | 0.36%(+26.9)#6 |
| 2. | Eldorado | 8.00% | 0.75%(+7.25)#2 | 0.36%(+7.64)#50 |
| 3. | Glenarden | 7.62% | 0.75%(+6.88)#3 | 0.36%(+7.26)#54 |
| 4. | Mitchellville | 5.60% | 0.75%(+4.85)#4 | 0.36%(+5.24)#101 |
| 5. | Spencerville | 5.32% | 0.75%(+4.58)#5 | 0.36%(+4.96)#113 |
| 6. | Largo | 4.98% | 0.75%(+4.24)#6 | 0.36%(+4.62)#119 |
| 7. | Laurel | 4.86% | 0.75%(+4.11)#7 | 0.36%(+4.50)#122 |
| 8. | Lake Arbor | 3.99% | 0.75%(+3.24)#8 | 0.36%(+3.62)#158 |
| 9. | Kettering | 3.78% | 0.75%(+3.03)#9 | 0.36%(+3.41)#169 |
| 10. | Westphalia | 3.73% | 0.75%(+2.98)#10 | 0.36%(+3.37)#170 |
| 11. | Fairland | 3.69% | 0.75%(+2.94)#11 | 0.36%(+3.32)#171 |
| 12. | Seabrook | 3.53% | 0.75%(+2.78)#12 | 0.36%(+3.17)#181 |
| 13. | West Laurel | 3.49% | 0.75%(+2.74)#13 | 0.36%(+3.12)#185 |
| 14. | Springdale | 3.45% | 0.75%(+2.71)#14 | 0.36%(+3.09)#187 |
| 15. | Maryland City | 3.42% | 0.75%(+2.67)#15 | 0.36%(+3.05)#191 |
| 16. | Fairwood | 3.33% | 0.75%(+2.58)#16 | 0.36%(+2.97)#200 |
| 17. | Capitol Heights | 3.30% | 0.75%(+2.55)#17 | 0.36%(+2.93)#203 |
| 18. | Prince Frederick | 3.01% | 0.75%(+2.26)#18 | 0.36%(+2.65)#230 |
| 19. | Federalsburg | 2.98% | 0.75%(+2.23)#19 | 0.36%(+2.62)#233 |
| 20. | South Laurel | 2.88% | 0.75%(+2.13)#20 | 0.36%(+2.51)#246 |
| 21. | Landover | 2.83% | 0.75%(+2.08)#21 | 0.36%(+2.47)#250 |
| 22. | National Harbor | 2.69% | 0.75%(+1.95)#22 | 0.36%(+2.33)#270 |
| 23. | Leisure World | 2.60% | 0.75%(+1.85)#23 | 0.36%(+2.23)#284 |
| 24. | New Carrollton | 2.50% | 0.75%(+1.75)#24 | 0.36%(+2.13)#296 |
| 25. | Layhill | 2.25% | 0.75%(+1.50)#25 | 0.36%(+1.89)#340 |
| 26. | Chillum | 2.24% | 0.75%(+1.49)#26 | 0.36%(+1.88)#343 |
| 27. | Greenbelt | 2.22% | 0.75%(+1.47)#27 | 0.36%(+1.86)#345 |
| 28. | Andrews Afb | 2.16% | 0.75%(+1.41)#28 | 0.36%(+1.80)#353 |
| 29. | Randallstown | 2.15% | 0.75%(+1.40)#29 | 0.36%(+1.78)#357 |
| 30. | Summerfield | 2.11% | 0.75%(+1.37)#30 | 0.36%(+1.75)#361 |
| 31. | West Pocomoke | 2.06% | 0.75%(+1.31)#31 | 0.36%(+1.70)#373 |
| 32. | Riverside | 2.04% | 0.75%(+1.29)#32 | 0.36%(+1.68)#379 |
| 33. | Bowie | 1.98% | 0.75%(+1.23)#33 | 0.36%(+1.62)#400 |
| 34. | Highland | 1.94% | 0.75%(+1.19)#34 | 0.36%(+1.58)#411 |
| 35. | Germantown | 1.93% | 0.75%(+1.18)#35 | 0.36%(+1.56)#413 |
| 36. | Owings Mills | 1.85% | 0.75%(+1.11)#36 | 0.36%(+1.49)#432 |
| 37. | Glenmont | 1.82% | 0.75%(+1.07)#37 | 0.36%(+1.46)#438 |
| 38. | Waldorf | 1.82% | 0.75%(+1.07)#38 | 0.36%(+1.46)#439 |
| 39. | Riverdale Park | 1.81% | 0.75%(+1.06)#39 | 0.36%(+1.45)#441 |
| 40. | Brock Hall | 1.79% | 0.75%(+1.04)#40 | 0.36%(+1.42)#448 |
| 41. | Milford Mill | 1.73% | 0.75%(+0.981)#41 | 0.36%(+1.37)#469 |
| 42. | Cottage City | 1.70% | 0.75%(+0.955)#42 | 0.36%(+1.34)#478 |
| 43. | Brentwood | 1.64% | 0.75%(+0.891)#43 | 0.36%(+1.28)#502 |
| 44. | Cedarville | 1.57% | 0.75%(+0.823)#44 | 0.36%(+1.21)#528 |
| 45. | Lochearn | 1.57% | 0.75%(+0.821)#45 | 0.36%(+1.21)#529 |
| 46. | Silver Hill | 1.56% | 0.75%(+0.809)#46 | 0.36%(+1.19)#533 |
| 47. | Lanham | 1.55% | 0.75%(+0.803)#47 | 0.36%(+1.19)#535 |
| 48. | Clinton | 1.52% | 0.75%(+0.768)#48 | 0.36%(+1.15)#549 |
| 49. | Fulton | 1.49% | 0.75%(+0.742)#49 | 0.36%(+1.13)#557 |
| 50. | Fort Washington | 1.48% | 0.75%(+0.726)#50 | 0.36%(+1.11)#565 |
| 51. | Marlboro Village | 1.47% | 0.75%(+0.720)#51 | 0.36%(+1.11)#569 |
| 52. | White Oak | 1.46% | 0.75%(+0.710)#52 | 0.36%(+1.10)#575 |
| 53. | Langley Park | 1.41% | 0.75%(+0.665)#53 | 0.36%(+1.05)#589 |
| 54. | Columbia | 1.40% | 0.75%(+0.651)#54 | 0.36%(+1.04)#593 |
| 55. | Colesville | 1.34% | 0.75%(+0.587)#55 | 0.36%(+0.972)#621 |
| 56. | Queensland | 1.33% | 0.75%(+0.579)#56 | 0.36%(+0.964)#628 |
| 57. | Landover Hills | 1.32% | 0.75%(+0.573)#57 | 0.36%(+0.958)#631 |
| 58. | Lansdowne | 1.32% | 0.75%(+0.570)#58 | 0.36%(+0.955)#633 |
| 59. | Elkridge | 1.31% | 0.75%(+0.566)#59 | 0.36%(+0.951)#636 |
| 60. | Silver Spring | 1.31% | 0.75%(+0.557)#60 | 0.36%(+0.942)#641 |
| 61. | Hyattsville | 1.28% | 0.75%(+0.527)#61 | 0.36%(+0.912)#660 |
| 62. | La Plata | 1.27% | 0.75%(+0.525)#62 | 0.36%(+0.910)#661 |
| 63. | Riviera Beach | 1.25% | 0.75%(+0.505)#63 | 0.36%(+0.890)#674 |
| 64. | Oxon Hill | 1.25% | 0.75%(+0.503)#64 | 0.36%(+0.889)#676 |
| 65. | Pasadena | 1.24% | 0.75%(+0.489)#65 | 0.36%(+0.874)#688 |
| 66. | Woodlawn Cdp Baltimore County | 1.20% | 0.75%(+0.449)#66 | 0.36%(+0.834)#715 |
| 67. | Timonium | 1.19% | 0.75%(+0.437)#67 | 0.36%(+0.822)#723 |
| 68. | Fountainhead Orchard Hills | 1.18% | 0.75%(+0.429)#68 | 0.36%(+0.814)#729 |
| 69. | North Laurel | 1.18% | 0.75%(+0.427)#69 | 0.36%(+0.812)#732 |
| 70. | Aspen Hill | 1.17% | 0.75%(+0.425)#70 | 0.36%(+0.810)#734 |
| 71. | Bensville | 1.17% | 0.75%(+0.420)#71 | 0.36%(+0.805)#737 |
| 72. | Mount Airy | 1.16% | 0.75%(+0.410)#72 | 0.36%(+0.795)#742 |
| 73. | Leonardtown | 1.16% | 0.75%(+0.407)#73 | 0.36%(+0.792)#747 |
| 74. | Hillandale | 1.14% | 0.75%(+0.391)#74 | 0.36%(+0.776)#753 |
| 75. | Adelphi | 1.13% | 0.75%(+0.384)#75 | 0.36%(+0.770)#757 |
| 76. | Havre De Grace | 1.12% | 0.75%(+0.370)#76 | 0.36%(+0.756)#770 |
| 77. | Wheaton | 1.06% | 0.75%(+0.312)#77 | 0.36%(+0.698)#815 |
| 78. | North Brentwood | 1.04% | 0.75%(+0.296)#78 | 0.36%(+0.681)#827 |
| 79. | Greensboro | 1.04% | 0.75%(+0.294)#79 | 0.36%(+0.680)#830 |
| 80. | Beltsville | 1.03% | 0.75%(+0.276)#80 | 0.36%(+0.662)#841 |
| 81. | Aquasco | 1.00% | 0.75%(+0.250)#81 | 0.36%(+0.635)#860 |
| 82. | Chevy Chase | 0.95% | 0.75%(+0.201)#82 | 0.36%(+0.586)#894 |
| 83. | Takoma Park | 0.95% | 0.75%(+0.197)#83 | 0.36%(+0.583)#900 |
| 84. | Cheverly | 0.95% | 0.75%(+0.197)#84 | 0.36%(+0.582)#901 |
| 85. | Woodlawn Cdp Prince George S County | 0.92% | 0.75%(+0.169)#85 | 0.36%(+0.555)#925 |
| 86. | East Riverdale | 0.91% | 0.75%(+0.158)#86 | 0.36%(+0.543)#935 |
| 87. | Coral Hills | 0.90% | 0.75%(+0.154)#87 | 0.36%(+0.539)#939 |
| 88. | Glassmanor | 0.89% | 0.75%(+0.144)#88 | 0.36%(+0.530)#949 |
| 89. | Travilah | 0.89% | 0.75%(+0.136)#89 | 0.36%(+0.522)#959 |
| 90. | Bel Air North | 0.88% | 0.75%(+0.133)#90 | 0.36%(+0.518)#960 |
| 91. | Essex | 0.88% | 0.75%(+0.130)#91 | 0.36%(+0.515)#964 |
| 92. | Odenton | 0.84% | 0.75%(+0.095)#92 | 0.36%(+0.480)#1,003 |
| 93. | Hillcrest Heights | 0.82% | 0.75%(+0.070)#93 | 0.36%(+0.456)#1,028 |
| 94. | Marlton | 0.82% | 0.75%(+0.067)#94 | 0.36%(+0.453)#1,034 |
| 95. | Flower Hill | 0.80% | 0.75%(+0.051)#95 | 0.36%(+0.436)#1,054 |
| 96. | Montgomery Village | 0.80% | 0.75%(+0.048)#96 | 0.36%(+0.434)#1,059 |
| 97. | Glen Burnie | 0.79% | 0.75%(+0.038)#97 | 0.36%(+0.423)#1,067 |
| 98. | Berwyn Heights | 0.79% | 0.75%(+0.036)#98 | 0.36%(+0.421)#1,070 |
| 99. | College Park | 0.78% | 0.75%(+0.033)#99 | 0.36%(+0.418)#1,077 |
| 100. | Olney | 0.78% | 0.75%(+0.031)#100 | 0.36%(+0.416)#1,078 |
Common Questions
What are the Top 10 Cities with the Highest Percentage of Jamaican Population in Maryland?
Top 10 Cities with the Highest Percentage of Jamaican Population in Maryland are:
#1
27.26%
#2
8.00%
#3
7.62%
#4
5.60%
#5
5.32%
#6
4.98%
#7
4.86%
#8
3.99%
#9
3.78%
#10
3.73%
What city has the Highest Percentage of Jamaican Population in Maryland?
Fairplay has the Highest Percentage of Jamaican Population in Maryland with 27.26%.
What is the Percentage of Jamaican Population in the State of Maryland?
Percentage of Jamaican Population in Maryland is 0.75%.
What is the Percentage of Jamaican Population in the United States?
Percentage of Jamaican Population in the United States is 0.36%.