Cities with the Highest Percentage of Immigrants from Western Africa in Pennsylvania
RELATED REPORTS & OPTIONS
Western Africa
Pennsylvania
Compare Cities
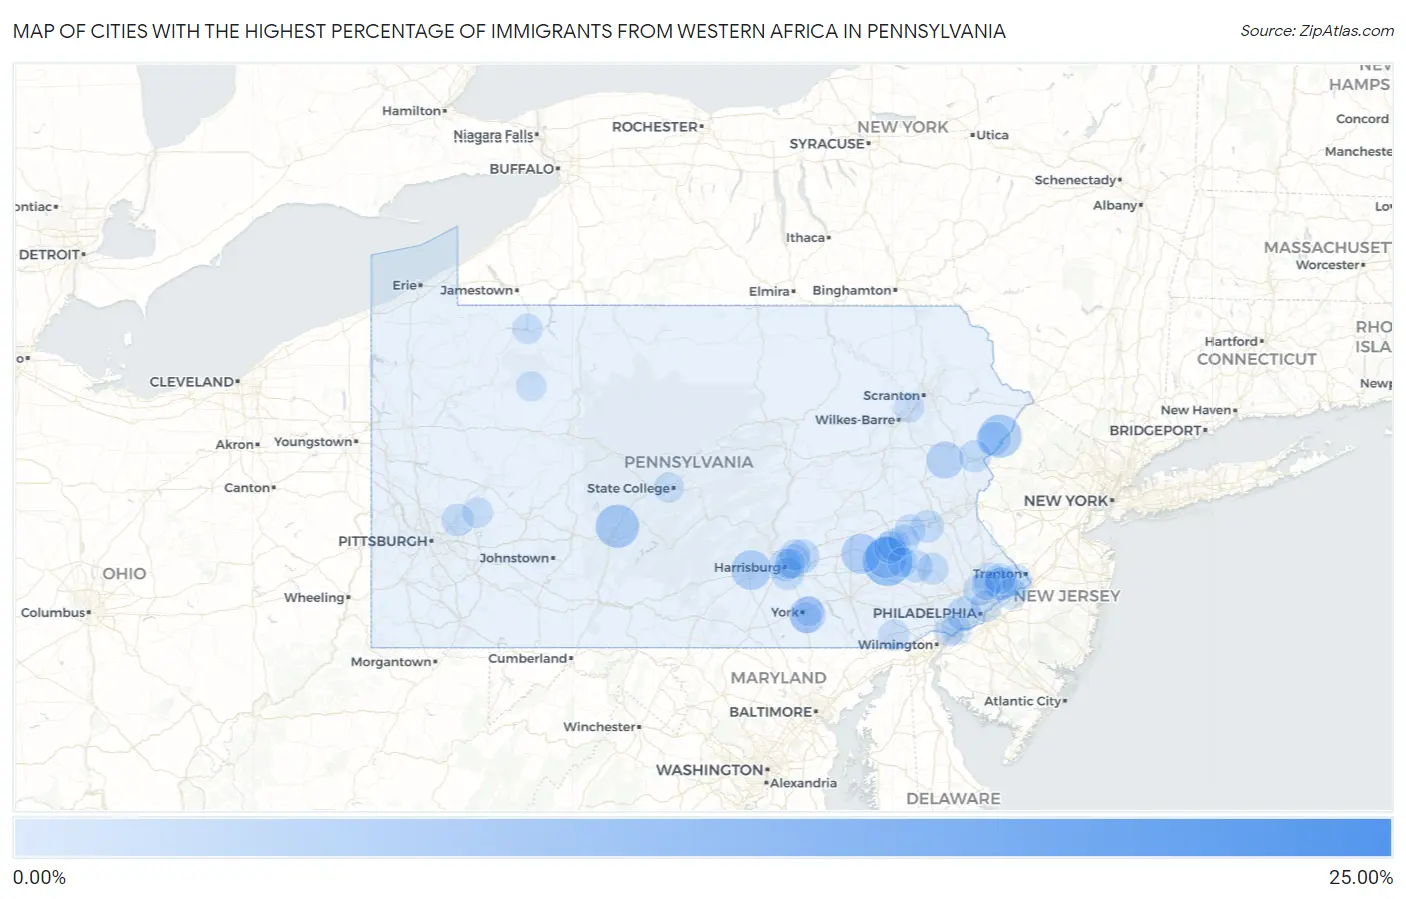
Map of Cities with the Highest Percentage of Immigrants from Western Africa in Pennsylvania
0.00%
25.00%
Cities with the Highest Percentage of Immigrants from Western Africa in Pennsylvania
| City | Western Africa | vs State | vs National | |
| 1. | Colwyn Borough | 22.18% | 0.31%(+21.9)#-1 | 0.30%(+21.9)#0 |
| 2. | Darby Borough | 11.10% | 0.31%(+10.8)#0 | 0.30%(+10.8)#1 |
| 3. | Sharon Hill Borough | 9.17% | 0.31%(+8.86)#1 | 0.30%(+8.87)#2 |
| 4. | Montrose Manor | 8.31% | 0.31%(+8.00)#2 | 0.30%(+8.02)#3 |
| 5. | South Coatesville Borough | 7.54% | 0.31%(+7.22)#3 | 0.30%(+7.24)#4 |
| 6. | Wall Borough | 7.41% | 0.31%(+7.10)#4 | 0.30%(+7.12)#5 |
| 7. | Millbourne Borough | 7.09% | 0.31%(+6.77)#5 | 0.30%(+6.79)#6 |
| 8. | Lansdowne Borough | 6.24% | 0.31%(+5.93)#6 | 0.30%(+5.95)#7 |
| 9. | Folcroft Borough | 5.93% | 0.31%(+5.62)#22 | 0.30%(+5.64)#150 |
| 10. | Greenwood | 5.81% | 0.31%(+5.50)#23 | 0.30%(+5.51)#151 |
| 11. | Pine Ridge | 5.71% | 0.31%(+5.39)#24 | 0.30%(+5.41)#152 |
| 12. | Yeadon Borough | 5.14% | 0.31%(+4.83)#25 | 0.30%(+4.85)#153 |
| 13. | West Lawn | 4.93% | 0.31%(+4.61)#26 | 0.30%(+4.63)#154 |
| 14. | Newmanstown | 4.40% | 0.31%(+4.08)#27 | 0.30%(+4.10)#155 |
| 15. | Schlusser | 4.31% | 0.31%(+4.00)#28 | 0.30%(+4.02)#171 |
| 16. | Aldan Borough | 3.64% | 0.31%(+3.33)#29 | 0.30%(+3.35)#172 |
| 17. | Collingdale Borough | 3.61% | 0.31%(+3.29)#30 | 0.30%(+3.31)#173 |
| 18. | Clifton Heights Borough | 3.48% | 0.31%(+3.17)#31 | 0.30%(+3.18)#174 |
| 19. | Sun Valley | 3.26% | 0.31%(+2.95)#32 | 0.30%(+2.97)#175 |
| 20. | Queens Gate | 2.94% | 0.31%(+2.63)#33 | 0.30%(+2.65)#176 |
| 21. | Glendon Borough | 2.60% | 0.31%(+2.29)#34 | 0.30%(+2.31)#177 |
| 22. | Trainer Borough | 2.44% | 0.31%(+2.13)#35 | 0.30%(+2.15)#178 |
| 23. | East Lansdowne Borough | 2.18% | 0.31%(+1.87)#36 | 0.30%(+1.89)#179 |
| 24. | Brentwood Borough | 2.08% | 0.31%(+1.77)#37 | 0.30%(+1.79)#180 |
| 25. | Mcconnellsburg Borough | 2.08% | 0.31%(+1.77)#38 | 0.30%(+1.79)#181 |
| 26. | Saw Creek | 2.04% | 0.31%(+1.72)#39 | 0.30%(+1.74)#182 |
| 27. | Drexel Hill | 2.02% | 0.31%(+1.71)#40 | 0.30%(+1.72)#197 |
| 28. | Colonial Park | 1.92% | 0.31%(+1.61)#41 | 0.30%(+1.63)#198 |
| 29. | Skyline View | 1.90% | 0.31%(+1.58)#42 | 0.30%(+1.60)#199 |
| 30. | Eddystone Borough | 1.89% | 0.31%(+1.57)#43 | 0.30%(+1.59)#200 |
| 31. | Breinigsville | 1.60% | 0.31%(+1.29)#44 | 0.30%(+1.31)#201 |
| 32. | Red Hill Borough | 1.58% | 0.31%(+1.26)#45 | 0.30%(+1.28)#202 |
| 33. | Freemansburg Borough | 1.57% | 0.31%(+1.26)#46 | 0.30%(+1.28)#203 |
| 34. | Feasterville | 1.57% | 0.31%(+1.25)#47 | 0.30%(+1.27)#204 |
| 35. | Morton Borough | 1.56% | 0.31%(+1.24)#48 | 0.30%(+1.26)#205 |
| 36. | Warminster Heights | 1.49% | 0.31%(+1.18)#49 | 0.30%(+1.20)#206 |
| 37. | Harrisburg | 1.48% | 0.31%(+1.16)#50 | 0.30%(+1.18)#207 |
| 38. | New Market | 1.43% | 0.31%(+1.12)#51 | 0.30%(+1.13)#208 |
| 39. | Trevose | 1.42% | 0.31%(+1.10)#52 | 0.30%(+1.12)#209 |
| 40. | Arnold | 1.40% | 0.31%(+1.09)#53 | 0.30%(+1.10)#210 |
| 41. | Hamburg Borough | 1.38% | 0.31%(+1.07)#54 | 0.30%(+1.08)#211 |
| 42. | Amity Gardens | 1.38% | 0.31%(+1.06)#55 | 0.30%(+1.08)#212 |
| 43. | Temple | 1.38% | 0.31%(+1.06)#56 | 0.30%(+1.08)#213 |
| 44. | Swarthmore Borough | 1.37% | 0.31%(+1.05)#57 | 0.30%(+1.07)#214 |
| 45. | Bellefonte Borough | 1.35% | 0.31%(+1.04)#58 | 0.30%(+1.05)#215 |
| 46. | Fox Chase | 1.35% | 0.31%(+1.03)#59 | 0.30%(+1.05)#216 |
| 47. | Arlington Heights | 1.32% | 0.31%(+1.00)#60 | 0.30%(+1.02)#217 |
| 48. | East Stroudsburg Borough | 1.28% | 0.31%(+0.969)#61 | 0.30%(+0.986)#218 |
| 49. | Prospect Park Borough | 1.28% | 0.31%(+0.964)#62 | 0.30%(+0.981)#219 |
| 50. | Mount Penn Borough | 1.27% | 0.31%(+0.958)#63 | 0.30%(+0.975)#220 |
| 51. | Rochester Borough | 1.21% | 0.31%(+0.899)#64 | 0.30%(+0.916)#221 |
| 52. | Penndel Borough | 1.20% | 0.31%(+0.886)#65 | 0.30%(+0.903)#222 |
| 53. | Sanatoga | 1.12% | 0.31%(+0.806)#66 | 0.30%(+0.824)#223 |
| 54. | Sinking Spring Borough | 1.10% | 0.31%(+0.788)#67 | 0.30%(+0.805)#224 |
| 55. | Penn State Berks | 1.08% | 0.31%(+0.764)#68 | 0.30%(+0.781)#225 |
| 56. | Fairless Hills | 1.01% | 0.31%(+0.695)#69 | 0.30%(+0.712)#226 |
| 57. | Bristol Borough | 1.00% | 0.31%(+0.689)#70 | 0.30%(+0.706)#227 |
| 58. | Glenolden Borough | 1.00% | 0.31%(+0.686)#71 | 0.30%(+0.704)#228 |
| 59. | Philadelphia | 0.99% | 0.31%(+0.674)#72 | 0.30%(+0.691)#549 |
| 60. | Croydon | 0.98% | 0.31%(+0.669)#73 | 0.30%(+0.687)#550 |
| 61. | Oreland | 0.95% | 0.31%(+0.632)#74 | 0.30%(+0.650)#551 |
| 62. | Kutztown University | 0.91% | 0.31%(+0.595)#75 | 0.30%(+0.613)#552 |
| 63. | Charleroi Borough | 0.88% | 0.31%(+0.561)#76 | 0.30%(+0.579)#553 |
| 64. | Tyler Run | 0.87% | 0.31%(+0.560)#77 | 0.30%(+0.577)#554 |
| 65. | Walnuttown | 0.86% | 0.31%(+0.547)#78 | 0.30%(+0.564)#555 |
| 66. | Lincoln University | 0.86% | 0.31%(+0.542)#79 | 0.30%(+0.559)#556 |
| 67. | Linglestown | 0.80% | 0.31%(+0.481)#80 | 0.30%(+0.498)#557 |
| 68. | Seven Fields Borough | 0.79% | 0.31%(+0.477)#81 | 0.30%(+0.495)#558 |
| 69. | Seward Borough | 0.79% | 0.31%(+0.477)#82 | 0.30%(+0.494)#559 |
| 70. | Steelton Borough | 0.69% | 0.31%(+0.374)#83 | 0.30%(+0.391)#560 |
| 71. | Hyde Park | 0.69% | 0.31%(+0.371)#84 | 0.30%(+0.388)#561 |
| 72. | Hatfield Borough | 0.66% | 0.31%(+0.344)#85 | 0.30%(+0.361)#562 |
| 73. | Penbrook Borough | 0.65% | 0.31%(+0.330)#86 | 0.30%(+0.347)#563 |
| 74. | Baldwin Borough | 0.62% | 0.31%(+0.306)#87 | 0.30%(+0.323)#564 |
| 75. | Braddock Hills Borough | 0.62% | 0.31%(+0.300)#88 | 0.30%(+0.318)#565 |
| 76. | Chester | 0.61% | 0.31%(+0.290)#89 | 0.30%(+0.308)#566 |
| 77. | Akron Borough | 0.60% | 0.31%(+0.290)#90 | 0.30%(+0.307)#567 |
| 78. | Elkins Park | 0.60% | 0.31%(+0.287)#91 | 0.30%(+0.305)#568 |
| 79. | Warren | 0.60% | 0.31%(+0.284)#92 | 0.30%(+0.301)#569 |
| 80. | Churchville | 0.60% | 0.31%(+0.281)#93 | 0.30%(+0.298)#570 |
| 81. | Boothwyn | 0.58% | 0.31%(+0.266)#94 | 0.30%(+0.284)#571 |
| 82. | Park Forest Village | 0.58% | 0.31%(+0.265)#95 | 0.30%(+0.283)#572 |
| 83. | Progress | 0.56% | 0.31%(+0.248)#96 | 0.30%(+0.266)#573 |
| 84. | Riverside Borough | 0.56% | 0.31%(+0.246)#97 | 0.30%(+0.264)#574 |
| 85. | Goldsboro Borough | 0.56% | 0.31%(+0.244)#98 | 0.30%(+0.261)#575 |
| 86. | Edinboro Borough | 0.54% | 0.31%(+0.230)#99 | 0.30%(+0.247)#576 |
| 87. | Whitehall Borough | 0.54% | 0.31%(+0.222)#100 | 0.30%(+0.239)#577 |
| 88. | Trafford Borough | 0.53% | 0.31%(+0.210)#101 | 0.30%(+0.228)#578 |
| 89. | Pittston | 0.51% | 0.31%(+0.198)#102 | 0.30%(+0.215)#579 |
| 90. | West Hazleton Borough | 0.51% | 0.31%(+0.192)#103 | 0.30%(+0.209)#580 |
| 91. | Greencastle Borough | 0.50% | 0.31%(+0.181)#104 | 0.30%(+0.198)#581 |
| 92. | Villanova | 0.49% | 0.31%(+0.180)#105 | 0.30%(+0.197)#582 |
| 93. | Bradford Woods Borough | 0.49% | 0.31%(+0.171)#106 | 0.30%(+0.188)#583 |
| 94. | Willow Grove | 0.48% | 0.31%(+0.165)#107 | 0.30%(+0.182)#584 |
| 95. | New Bethlehem Borough | 0.47% | 0.31%(+0.158)#108 | 0.30%(+0.176)#585 |
| 96. | Marienville | 0.47% | 0.31%(+0.155)#109 | 0.30%(+0.172)#586 |
| 97. | Lorane | 0.46% | 0.31%(+0.143)#110 | 0.30%(+0.161)#587 |
| 98. | Trappe Borough | 0.45% | 0.31%(+0.138)#111 | 0.30%(+0.155)#588 |
| 99. | Langhorne Manor Borough | 0.45% | 0.31%(+0.133)#112 | 0.30%(+0.150)#589 |
| 100. | East York | 0.42% | 0.31%(+0.103)#113 | 0.30%(+0.120)#590 |
Common Questions
What are the Top 10 Cities with the Highest Percentage of Immigrants from Western Africa in Pennsylvania?
Top 10 Cities with the Highest Percentage of Immigrants from Western Africa in Pennsylvania are:
#1
8.31%
#2
5.81%
#3
5.71%
#4
4.93%
#5
4.40%
#6
4.31%
#7
3.26%
#8
2.94%
#9
2.04%
#10
2.02%
What city has the Highest Percentage of Immigrants from Western Africa in Pennsylvania?
Montrose Manor has the Highest Percentage of Immigrants from Western Africa in Pennsylvania with 8.31%.
What is the Percentage of Immigrants from Western Africa in the State of Pennsylvania?
Percentage of Immigrants from Western Africa in Pennsylvania is 0.31%.
What is the Percentage of Immigrants from Western Africa in the United States?
Percentage of Immigrants from Western Africa in the United States is 0.30%.