Cities with the Largest Chippewa Community in Michigan
RELATED REPORTS & OPTIONS
Chippewa
Michigan
Compare Cities
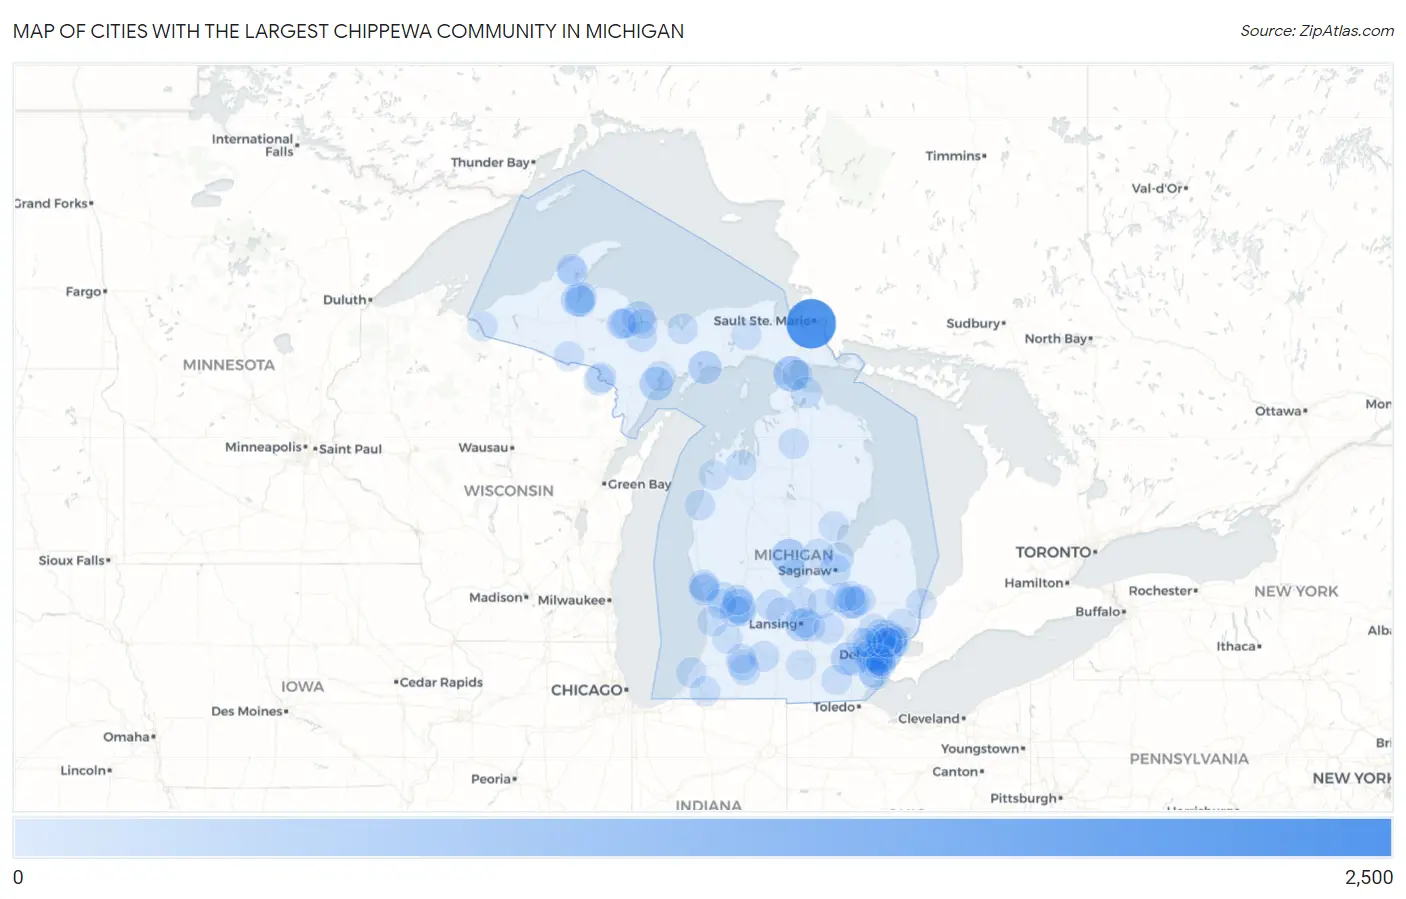
Map of Cities with the Largest Chippewa Community in Michigan
0
2,500
Cities with the Largest Chippewa Community in Michigan
| City | Chippewa | vs State | vs National | |
| 1. | Sault Ste Marie | 2,246 | 35,959(6.25%)#1 | 191,286(1.17%)#2 |
| 2. | Kincheloe | 775 | 35,959(2.16%)#2 | 191,286(0.41%)#19 |
| 3. | Detroit | 755 | 35,959(2.10%)#3 | 191,286(0.39%)#21 |
| 4. | St Ignace | 628 | 35,959(1.75%)#4 | 191,286(0.33%)#28 |
| 5. | Mount Pleasant | 545 | 35,959(1.52%)#5 | 191,286(0.28%)#37 |
| 6. | Grand Rapids | 490 | 35,959(1.36%)#6 | 191,286(0.26%)#43 |
| 7. | Escanaba | 409 | 35,959(1.14%)#7 | 191,286(0.21%)#49 |
| 8. | Manistique | 358 | 35,959(1.00%)#8 | 191,286(0.19%)#58 |
| 9. | Ann Arbor | 355 | 35,959(0.99%)#9 | 191,286(0.19%)#59 |
| 10. | Baraga | 346 | 35,959(0.96%)#10 | 191,286(0.18%)#60 |
| 11. | Lansing | 305 | 35,959(0.85%)#11 | 191,286(0.16%)#67 |
| 12. | Marquette | 302 | 35,959(0.84%)#12 | 191,286(0.16%)#68 |
| 13. | Flint | 284 | 35,959(0.79%)#13 | 191,286(0.15%)#71 |
| 14. | Troy | 238 | 35,959(0.66%)#14 | 191,286(0.12%)#93 |
| 15. | Burton | 227 | 35,959(0.63%)#15 | 191,286(0.12%)#96 |
| 16. | Warren | 220 | 35,959(0.61%)#16 | 191,286(0.12%)#99 |
| 17. | Zeba | 172 | 35,959(0.48%)#17 | 191,286(0.09%)#130 |
| 18. | Saginaw | 169 | 35,959(0.47%)#18 | 191,286(0.09%)#131 |
| 19. | L Anse | 166 | 35,959(0.46%)#19 | 191,286(0.09%)#135 |
| 20. | Livonia | 165 | 35,959(0.46%)#20 | 191,286(0.09%)#136 |
| 21. | Lincoln Park | 165 | 35,959(0.46%)#21 | 191,286(0.09%)#137 |
| 22. | K I Sawyer | 163 | 35,959(0.45%)#22 | 191,286(0.09%)#138 |
| 23. | Westland | 161 | 35,959(0.45%)#23 | 191,286(0.08%)#141 |
| 24. | Cheboygan | 157 | 35,959(0.44%)#24 | 191,286(0.08%)#146 |
| 25. | Dearborn | 150 | 35,959(0.42%)#25 | 191,286(0.08%)#155 |
| 26. | Coopersville | 145 | 35,959(0.40%)#26 | 191,286(0.08%)#162 |
| 27. | Wyoming | 131 | 35,959(0.36%)#27 | 191,286(0.07%)#184 |
| 28. | Ionia | 125 | 35,959(0.35%)#28 | 191,286(0.07%)#192 |
| 29. | Okemos | 120 | 35,959(0.33%)#29 | 191,286(0.06%)#204 |
| 30. | Negaunee | 120 | 35,959(0.33%)#30 | 191,286(0.06%)#205 |
| 31. | Vicksburg | 111 | 35,959(0.31%)#31 | 191,286(0.06%)#232 |
| 32. | St Johns | 104 | 35,959(0.29%)#32 | 191,286(0.05%)#251 |
| 33. | Battle Creek | 103 | 35,959(0.29%)#33 | 191,286(0.05%)#253 |
| 34. | Traverse City | 100 | 35,959(0.28%)#34 | 191,286(0.05%)#261 |
| 35. | Portage | 96 | 35,959(0.27%)#35 | 191,286(0.05%)#279 |
| 36. | Bay City | 96 | 35,959(0.27%)#36 | 191,286(0.05%)#280 |
| 37. | Muskegon | 93 | 35,959(0.26%)#37 | 191,286(0.05%)#290 |
| 38. | Munising | 93 | 35,959(0.26%)#38 | 191,286(0.05%)#292 |
| 39. | Flushing | 90 | 35,959(0.25%)#39 | 191,286(0.05%)#302 |
| 40. | Gladstone | 89 | 35,959(0.25%)#40 | 191,286(0.05%)#305 |
| 41. | Davison | 89 | 35,959(0.25%)#41 | 191,286(0.05%)#306 |
| 42. | Dearborn Heights | 86 | 35,959(0.24%)#42 | 191,286(0.04%)#313 |
| 43. | Kingsford | 86 | 35,959(0.24%)#43 | 191,286(0.04%)#317 |
| 44. | Ishpeming | 85 | 35,959(0.24%)#44 | 191,286(0.04%)#322 |
| 45. | St Clair Shores | 84 | 35,959(0.23%)#45 | 191,286(0.04%)#324 |
| 46. | Norton Shores | 84 | 35,959(0.23%)#46 | 191,286(0.04%)#326 |
| 47. | Garden City | 83 | 35,959(0.23%)#47 | 191,286(0.04%)#330 |
| 48. | Portland | 83 | 35,959(0.23%)#48 | 191,286(0.04%)#332 |
| 49. | Sterling Heights | 82 | 35,959(0.23%)#49 | 191,286(0.04%)#334 |
| 50. | Midland | 81 | 35,959(0.23%)#50 | 191,286(0.04%)#339 |
| 51. | Ferndale | 80 | 35,959(0.22%)#51 | 191,286(0.04%)#346 |
| 52. | Roseville | 77 | 35,959(0.21%)#52 | 191,286(0.04%)#361 |
| 53. | East Lansing | 77 | 35,959(0.21%)#53 | 191,286(0.04%)#362 |
| 54. | Allendale | 76 | 35,959(0.21%)#54 | 191,286(0.04%)#367 |
| 55. | Taylor | 75 | 35,959(0.21%)#55 | 191,286(0.04%)#372 |
| 56. | St Joseph | 75 | 35,959(0.21%)#56 | 191,286(0.04%)#374 |
| 57. | Gaylord | 75 | 35,959(0.21%)#57 | 191,286(0.04%)#375 |
| 58. | Fowlerville | 75 | 35,959(0.21%)#58 | 191,286(0.04%)#377 |
| 59. | Eastpointe | 74 | 35,959(0.21%)#59 | 191,286(0.04%)#381 |
| 60. | Kentwood | 73 | 35,959(0.20%)#60 | 191,286(0.04%)#385 |
| 61. | Holland | 69 | 35,959(0.19%)#61 | 191,286(0.04%)#399 |
| 62. | Port Huron | 69 | 35,959(0.19%)#62 | 191,286(0.04%)#400 |
| 63. | Kalamazoo | 67 | 35,959(0.19%)#63 | 191,286(0.04%)#413 |
| 64. | Fraser | 65 | 35,959(0.18%)#64 | 191,286(0.03%)#431 |
| 65. | Rockwood | 65 | 35,959(0.18%)#65 | 191,286(0.03%)#434 |
| 66. | Houghton | 63 | 35,959(0.18%)#66 | 191,286(0.03%)#443 |
| 67. | Melvindale | 62 | 35,959(0.17%)#67 | 191,286(0.03%)#448 |
| 68. | Niles | 61 | 35,959(0.17%)#68 | 191,286(0.03%)#457 |
| 69. | Mackinac Island | 60 | 35,959(0.17%)#69 | 191,286(0.03%)#466 |
| 70. | Harvey | 57 | 35,959(0.16%)#70 | 191,286(0.03%)#482 |
| 71. | Comstock Park | 55 | 35,959(0.15%)#71 | 191,286(0.03%)#501 |
| 72. | Iron Mountain | 55 | 35,959(0.15%)#72 | 191,286(0.03%)#502 |
| 73. | Manistee | 55 | 35,959(0.15%)#73 | 191,286(0.03%)#503 |
| 74. | Allen Park | 54 | 35,959(0.15%)#74 | 191,286(0.03%)#507 |
| 75. | Huntington Woods | 54 | 35,959(0.15%)#75 | 191,286(0.03%)#508 |
| 76. | Beecher | 53 | 35,959(0.15%)#76 | 191,286(0.03%)#514 |
| 77. | Iron River | 49 | 35,959(0.14%)#77 | 191,286(0.03%)#549 |
| 78. | Newberry | 49 | 35,959(0.14%)#78 | 191,286(0.03%)#552 |
| 79. | Brimley | 48 | 35,959(0.13%)#79 | 191,286(0.03%)#563 |
| 80. | Tecumseh | 46 | 35,959(0.13%)#80 | 191,286(0.02%)#576 |
| 81. | Flat Rock | 45 | 35,959(0.13%)#81 | 191,286(0.02%)#587 |
| 82. | Muskegon Heights | 44 | 35,959(0.12%)#82 | 191,286(0.02%)#600 |
| 83. | Wyandotte | 43 | 35,959(0.12%)#83 | 191,286(0.02%)#611 |
| 84. | Benzonia | 43 | 35,959(0.12%)#84 | 191,286(0.02%)#618 |
| 85. | Owosso | 39 | 35,959(0.11%)#85 | 191,286(0.02%)#655 |
| 86. | Alma | 37 | 35,959(0.10%)#86 | 191,286(0.02%)#685 |
| 87. | Ironwood | 37 | 35,959(0.10%)#87 | 191,286(0.02%)#686 |
| 88. | West Ishpeming | 37 | 35,959(0.10%)#88 | 191,286(0.02%)#687 |
| 89. | Ypsilanti | 36 | 35,959(0.10%)#89 | 191,286(0.02%)#693 |
| 90. | Ecorse | 36 | 35,959(0.10%)#90 | 191,286(0.02%)#697 |
| 91. | New Haven | 36 | 35,959(0.10%)#91 | 191,286(0.02%)#699 |
| 92. | Spring Arbor | 36 | 35,959(0.10%)#92 | 191,286(0.02%)#701 |
| 93. | Allegan | 35 | 35,959(0.10%)#93 | 191,286(0.02%)#718 |
| 94. | Hancock | 35 | 35,959(0.10%)#94 | 191,286(0.02%)#721 |
| 95. | Standish | 35 | 35,959(0.10%)#95 | 191,286(0.02%)#724 |
| 96. | Auburn Hills | 34 | 35,959(0.09%)#96 | 191,286(0.02%)#735 |
| 97. | Clawson | 34 | 35,959(0.09%)#97 | 191,286(0.02%)#738 |
| 98. | Farmington Hills | 33 | 35,959(0.09%)#98 | 191,286(0.02%)#751 |
| 99. | Novi | 33 | 35,959(0.09%)#99 | 191,286(0.02%)#752 |
| 100. | Center Line | 33 | 35,959(0.09%)#100 | 191,286(0.02%)#761 |
Common Questions
What are the Top 10 Cities with the Largest Chippewa Community in Michigan?
Top 10 Cities with the Largest Chippewa Community in Michigan are:
#1
2,246
#2
755
#3
628
#4
545
#5
490
#6
409
#7
358
#8
355
#9
346
#10
305
What city has the Largest Chippewa Community in Michigan?
Sault Ste Marie has the Largest Chippewa Community in Michigan with 2,246.
What is the Total Chippewa Population in the State of Michigan?
Total Chippewa Population in Michigan is 35,959.
What is the Total Chippewa Population in the United States?
Total Chippewa Population in the United States is 191,286.