Cities with the Most Immigrants from Hungary in Pennsylvania
RELATED REPORTS & OPTIONS
Hungary
Pennsylvania
Compare Cities
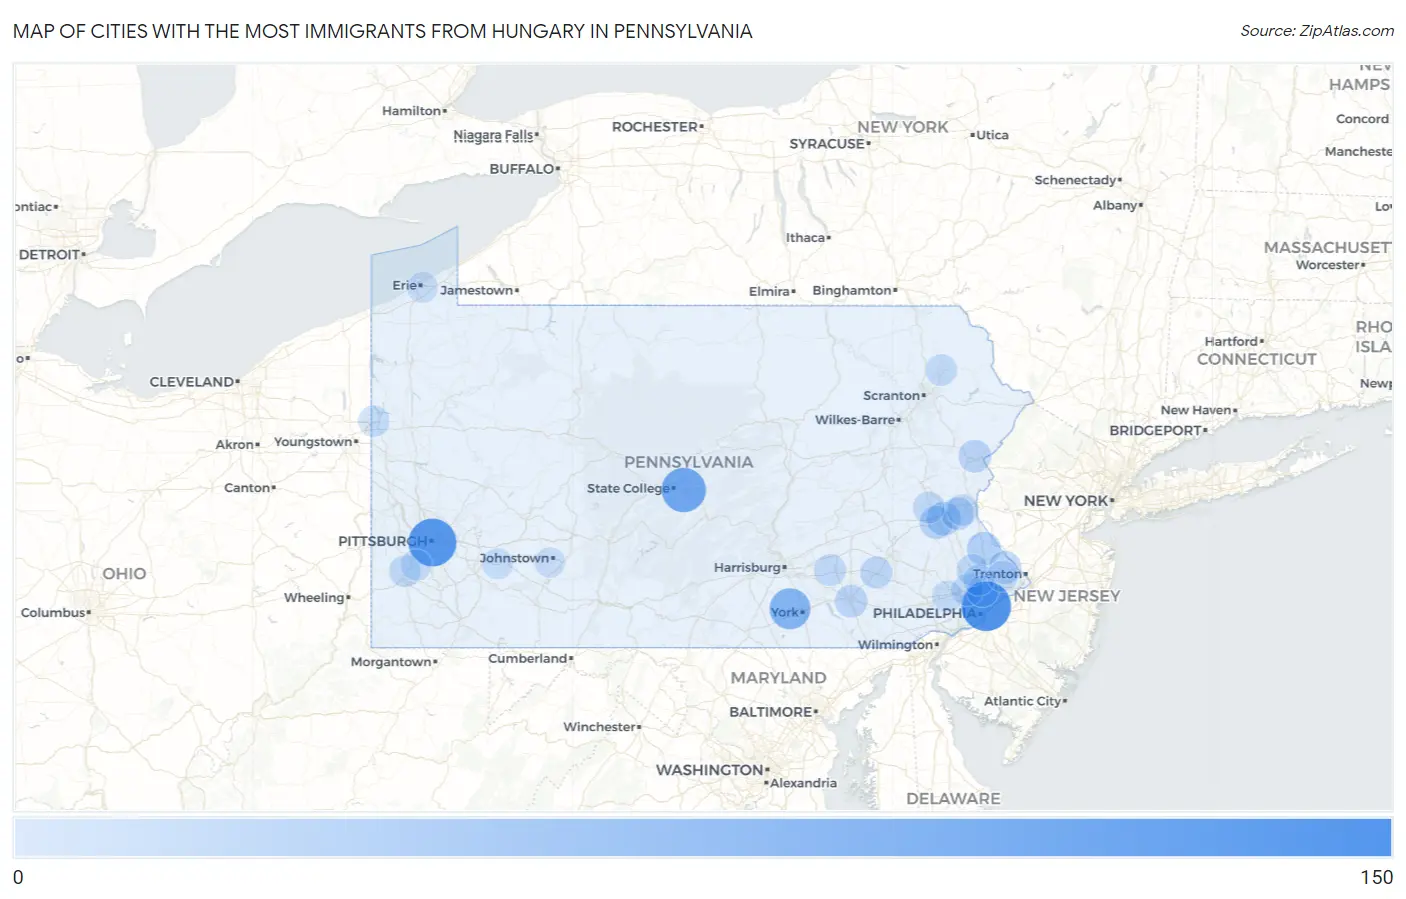
Map of Cities with the Most Immigrants from Hungary in Pennsylvania
0
150
Cities with the Most Immigrants from Hungary in Pennsylvania
| City | Hungary | vs State | vs National | |
| 1. | Philadelphia | 144 | 2,267(6.35%)#1 | 64,894(0.22%)#40 |
| 2. | Pittsburgh | 131 | 2,267(5.78%)#2 | 64,894(0.20%)#45 |
| 3. | Boalsburg | 104 | 2,267(4.59%)#3 | 64,894(0.16%)#71 |
| 4. | Weigelstown | 78 | 2,267(3.44%)#4 | 64,894(0.12%)#125 |
| 5. | Kutztown Borough | 39 | 2,267(1.72%)#5 | 64,894(0.06%)#322 |
| 6. | Castle Shannon Borough | 38 | 2,267(1.68%)#6 | 64,894(0.06%)#335 |
| 7. | Media Borough | 37 | 2,267(1.63%)#7 | 64,894(0.06%)#347 |
| 8. | Jenkintown Borough | 36 | 2,267(1.59%)#8 | 64,894(0.06%)#353 |
| 9. | Duryea Borough | 35 | 2,267(1.54%)#9 | 64,894(0.05%)#366 |
| 10. | Doylestown Borough | 33 | 2,267(1.46%)#10 | 64,894(0.05%)#392 |
| 11. | Allentown | 26 | 2,267(1.15%)#11 | 64,894(0.04%)#489 |
| 12. | Plumsteadville | 26 | 2,267(1.15%)#12 | 64,894(0.04%)#510 |
| 13. | Wescosville | 22 | 2,267(0.97%)#13 | 64,894(0.03%)#594 |
| 14. | Newtown Grant | 20 | 2,267(0.88%)#14 | 64,894(0.03%)#642 |
| 15. | Arlington Heights | 19 | 2,267(0.84%)#15 | 64,894(0.03%)#670 |
| 16. | Bethlehem | 18 | 2,267(0.79%)#16 | 64,894(0.03%)#680 |
| 17. | Lancaster | 17 | 2,267(0.75%)#17 | 64,894(0.03%)#716 |
| 18. | Carlisle Borough | 17 | 2,267(0.75%)#18 | 64,894(0.03%)#723 |
| 19. | Baldwin Borough | 15 | 2,267(0.66%)#19 | 64,894(0.02%)#783 |
| 20. | Swartzville | 14 | 2,267(0.62%)#20 | 64,894(0.02%)#841 |
| 21. | Plymouth Meeting | 12 | 2,267(0.53%)#21 | 64,894(0.02%)#925 |
| 22. | Timber Hills | 12 | 2,267(0.53%)#22 | 64,894(0.02%)#935 |
| 23. | Pottstown Borough | 11 | 2,267(0.49%)#23 | 64,894(0.02%)#955 |
| 24. | West Mifflin Borough | 11 | 2,267(0.49%)#24 | 64,894(0.02%)#957 |
| 25. | Montgomeryville | 11 | 2,267(0.49%)#25 | 64,894(0.02%)#965 |
| 26. | Narberth Borough | 11 | 2,267(0.49%)#26 | 64,894(0.02%)#975 |
| 27. | Mcgovern | 11 | 2,267(0.49%)#27 | 64,894(0.02%)#977 |
| 28. | Schnecksville | 11 | 2,267(0.49%)#28 | 64,894(0.02%)#979 |
| 29. | Elizabethville Borough | 11 | 2,267(0.49%)#29 | 64,894(0.02%)#983 |
| 30. | Carbondale | 10 | 2,267(0.44%)#30 | 64,894(0.02%)#1,023 |
| 31. | Glenside | 10 | 2,267(0.44%)#31 | 64,894(0.02%)#1,025 |
| 32. | Sharpsville Borough | 10 | 2,267(0.44%)#32 | 64,894(0.02%)#1,035 |
| 33. | Middletown | 9 | 2,267(0.40%)#33 | 64,894(0.01%)#1,093 |
| 34. | New Cumberland Borough | 8 | 2,267(0.35%)#34 | 64,894(0.01%)#1,161 |
| 35. | Oakmont Borough | 8 | 2,267(0.35%)#35 | 64,894(0.01%)#1,164 |
| 36. | Greencastle Borough | 8 | 2,267(0.35%)#36 | 64,894(0.01%)#1,169 |
| 37. | Frackville Borough | 8 | 2,267(0.35%)#37 | 64,894(0.01%)#1,172 |
| 38. | Sharon | 7 | 2,267(0.31%)#38 | 64,894(0.01%)#1,216 |
| 39. | Maple Glen | 7 | 2,267(0.31%)#39 | 64,894(0.01%)#1,227 |
| 40. | Chesterbrook | 7 | 2,267(0.31%)#40 | 64,894(0.01%)#1,233 |
| 41. | Thompsonville | 7 | 2,267(0.31%)#41 | 64,894(0.01%)#1,238 |
| 42. | Village Shires | 7 | 2,267(0.31%)#42 | 64,894(0.01%)#1,242 |
| 43. | Muncy Borough | 7 | 2,267(0.31%)#43 | 64,894(0.01%)#1,244 |
| 44. | Milford Borough | 7 | 2,267(0.31%)#44 | 64,894(0.01%)#1,251 |
| 45. | Wyomissing Borough | 6 | 2,267(0.26%)#45 | 64,894(0.01%)#1,284 |
| 46. | Quarryville Borough | 6 | 2,267(0.26%)#46 | 64,894(0.01%)#1,300 |
| 47. | Topton Borough | 6 | 2,267(0.26%)#47 | 64,894(0.01%)#1,302 |
| 48. | Green Lane Borough | 6 | 2,267(0.26%)#48 | 64,894(0.01%)#1,310 |
| 49. | Lansdale Borough | 5 | 2,267(0.22%)#49 | 64,894(0.01%)#1,332 |
| 50. | Morrisville Borough | 5 | 2,267(0.22%)#50 | 64,894(0.01%)#1,339 |
| 51. | Coopersburg Borough | 5 | 2,267(0.22%)#51 | 64,894(0.01%)#1,350 |
| 52. | East Mckeesport Borough | 5 | 2,267(0.22%)#52 | 64,894(0.01%)#1,352 |
| 53. | St Vincent College | 5 | 2,267(0.22%)#53 | 64,894(0.01%)#1,358 |
| 54. | Erie | 4 | 2,267(0.18%)#54 | 64,894(0.01%)#1,366 |
| 55. | Phoenixville Borough | 4 | 2,267(0.18%)#55 | 64,894(0.01%)#1,381 |
| 56. | Tremont Borough | 4 | 2,267(0.18%)#56 | 64,894(0.01%)#1,393 |
| 57. | Newville Borough | 4 | 2,267(0.18%)#57 | 64,894(0.01%)#1,398 |
| 58. | Haysville Borough | 4 | 2,267(0.18%)#58 | 64,894(0.01%)#1,404 |
| 59. | Bradford Woods Borough | 3 | 2,267(0.13%)#59 | 64,894(0.00%)#1,441 |
| 60. | Riegelsville Borough | 3 | 2,267(0.13%)#60 | 64,894(0.00%)#1,449 |
| 61. | East Prospect Borough | 3 | 2,267(0.13%)#61 | 64,894(0.00%)#1,450 |
| 62. | Sewickley Heights Borough | 3 | 2,267(0.13%)#62 | 64,894(0.00%)#1,451 |
| 63. | Elim | 2 | 2,267(0.09%)#63 | 64,894(0.00%)#1,472 |
| 64. | Mont Clare | 2 | 2,267(0.09%)#64 | 64,894(0.00%)#1,477 |
| 65. | Ben Avon Borough | 2 | 2,267(0.09%)#65 | 64,894(0.00%)#1,481 |
| 66. | Whitaker Borough | 2 | 2,267(0.09%)#66 | 64,894(0.00%)#1,483 |
| 67. | Centerport Borough | 2 | 2,267(0.09%)#67 | 64,894(0.00%)#1,505 |
| 68. | Swissvale Borough | 1 | 2,267(0.04%)#68 | 64,894(0.00%)#1,515 |
| 69. | Eagles Mere Borough | 1 | 2,267(0.04%)#69 | 64,894(0.00%)#1,534 |
Common Questions
What are the Top 10 Cities with the Most Immigrants from Hungary in Pennsylvania?
Top 10 Cities with the Most Immigrants from Hungary in Pennsylvania are:
#1
144
#2
131
#3
104
#4
78
#5
26
#6
26
#7
22
#8
20
#9
19
#10
18
What city has the Most Immigrants from Hungary in Pennsylvania?
Philadelphia has the Most Immigrants from Hungary in Pennsylvania with 144.
What is the Total Immigrants from Hungary in the State of Pennsylvania?
Total Immigrants from Hungary in Pennsylvania is 2,267.
What is the Total Immigrants from Hungary in the United States?
Total Immigrants from Hungary in the United States is 64,894.