Cities with the Most Immigrants from Hungary in Michigan
RELATED REPORTS & OPTIONS
Hungary
Michigan
Compare Cities
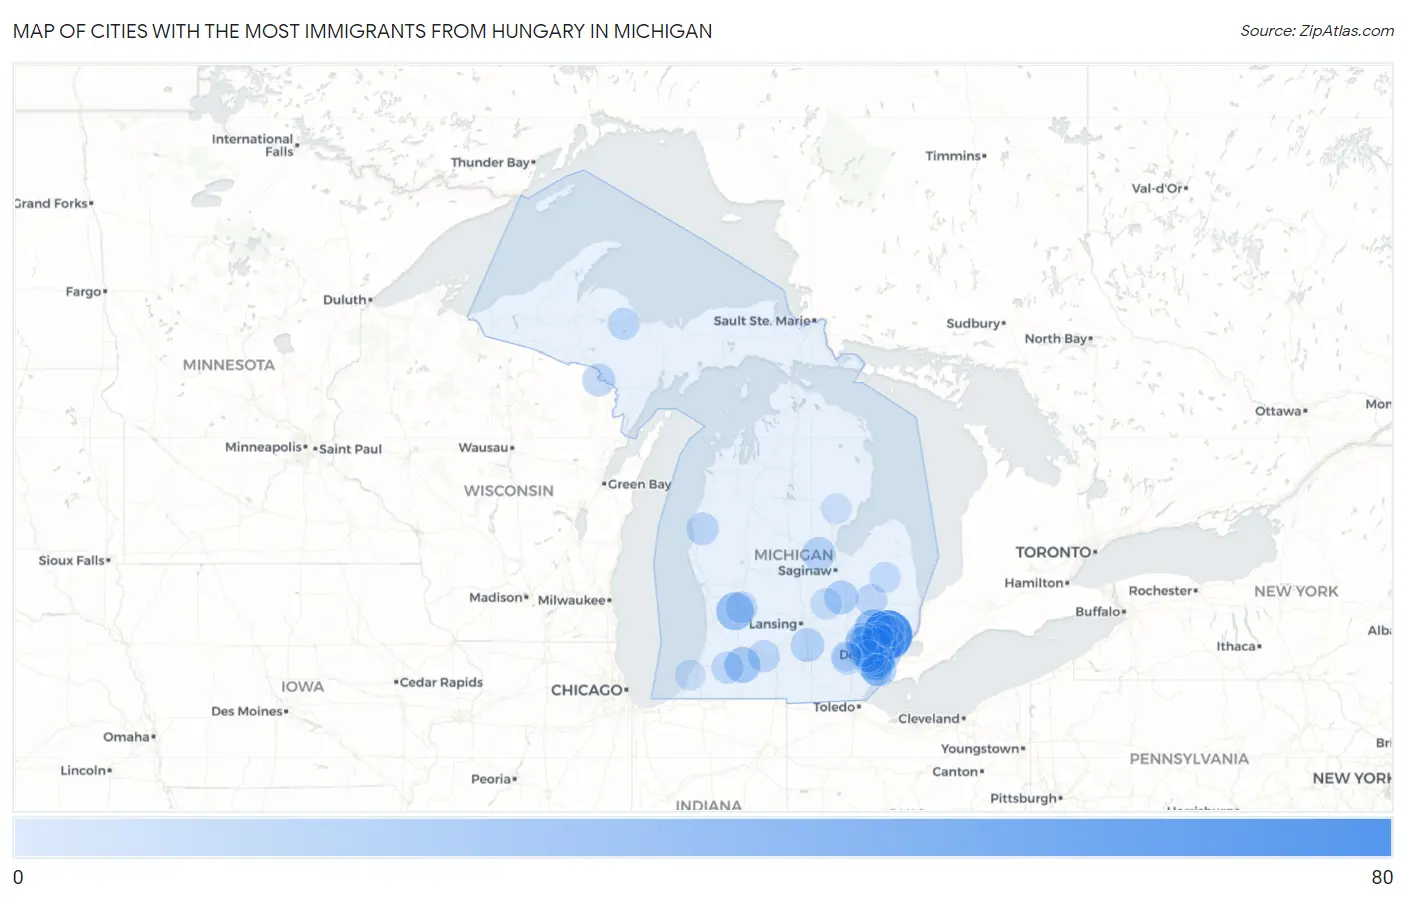
Map of Cities with the Most Immigrants from Hungary in Michigan
0
80
Cities with the Most Immigrants from Hungary in Michigan
| City | Hungary | vs State | vs National | |
| 1. | Sterling Heights | 73 | 873(8.36%)#1 | 64,894(0.11%)#134 |
| 2. | Auburn Hills | 32 | 873(3.67%)#2 | 64,894(0.05%)#401 |
| 3. | Wyoming | 28 | 873(3.21%)#3 | 64,894(0.04%)#454 |
| 4. | Oak Park | 28 | 873(3.21%)#4 | 64,894(0.04%)#464 |
| 5. | Livonia | 21 | 873(2.41%)#5 | 64,894(0.03%)#598 |
| 6. | Farmington Hills | 21 | 873(2.41%)#6 | 64,894(0.03%)#599 |
| 7. | Taylor | 21 | 873(2.41%)#7 | 64,894(0.03%)#600 |
| 8. | Portage | 21 | 873(2.41%)#8 | 64,894(0.03%)#602 |
| 9. | Detroit | 20 | 873(2.29%)#9 | 64,894(0.03%)#620 |
| 10. | Trenton | 20 | 873(2.29%)#10 | 64,894(0.03%)#633 |
| 11. | Warren | 16 | 873(1.83%)#11 | 64,894(0.02%)#740 |
| 12. | Royal Oak | 15 | 873(1.72%)#12 | 64,894(0.02%)#777 |
| 13. | Allen Park | 15 | 873(1.72%)#13 | 64,894(0.02%)#781 |
| 14. | Flushing | 14 | 873(1.60%)#14 | 64,894(0.02%)#835 |
| 15. | Rochester Hills | 13 | 873(1.49%)#15 | 64,894(0.02%)#847 |
| 16. | Southgate | 13 | 873(1.49%)#16 | 64,894(0.02%)#858 |
| 17. | Leslie | 13 | 873(1.49%)#17 | 64,894(0.02%)#883 |
| 18. | Midland | 12 | 873(1.37%)#18 | 64,894(0.02%)#899 |
| 19. | Inkster | 11 | 873(1.26%)#19 | 64,894(0.02%)#952 |
| 20. | Kingsford | 10 | 873(1.15%)#20 | 64,894(0.02%)#1,030 |
| 21. | Southfield | 9 | 873(1.03%)#21 | 64,894(0.01%)#1,056 |
| 22. | Walled Lake | 9 | 873(1.03%)#22 | 64,894(0.01%)#1,092 |
| 23. | Scottville | 9 | 873(1.03%)#23 | 64,894(0.01%)#1,102 |
| 24. | Battle Creek | 8 | 873(0.92%)#24 | 64,894(0.01%)#1,119 |
| 25. | Plymouth | 8 | 873(0.92%)#25 | 64,894(0.01%)#1,156 |
| 26. | Lawton | 8 | 873(0.92%)#26 | 64,894(0.01%)#1,176 |
| 27. | Westland | 7 | 873(0.80%)#27 | 64,894(0.01%)#1,187 |
| 28. | Novi | 7 | 873(0.80%)#28 | 64,894(0.01%)#1,191 |
| 29. | East Grand Rapids | 7 | 873(0.80%)#29 | 64,894(0.01%)#1,218 |
| 30. | Lapeer | 7 | 873(0.80%)#30 | 64,894(0.01%)#1,224 |
| 31. | Ishpeming | 7 | 873(0.80%)#31 | 64,894(0.01%)#1,230 |
| 32. | Utica | 7 | 873(0.80%)#32 | 64,894(0.01%)#1,234 |
| 33. | Ann Arbor | 6 | 873(0.69%)#33 | 64,894(0.01%)#1,254 |
| 34. | Woodhaven | 5 | 873(0.57%)#34 | 64,894(0.01%)#1,335 |
| 35. | Corunna | 5 | 873(0.57%)#35 | 64,894(0.01%)#1,348 |
| 36. | Birmingham | 4 | 873(0.46%)#36 | 64,894(0.01%)#1,378 |
| 37. | Marlette | 4 | 873(0.46%)#37 | 64,894(0.01%)#1,392 |
| 38. | Shoreham | 2 | 873(0.23%)#38 | 64,894(0.00%)#1,488 |
| 39. | Barton Hills | 2 | 873(0.23%)#39 | 64,894(0.00%)#1,503 |
| 40. | Prescott | 1 | 873(0.11%)#40 | 64,894(0.00%)#1,528 |
Common Questions
What are the Top 10 Cities with the Most Immigrants from Hungary in Michigan?
Top 10 Cities with the Most Immigrants from Hungary in Michigan are:
#1
73
#2
32
#3
28
#4
28
#5
21
#6
21
#7
21
#8
21
#9
20
#10
20
What city has the Most Immigrants from Hungary in Michigan?
Sterling Heights has the Most Immigrants from Hungary in Michigan with 73.
What is the Total Immigrants from Hungary in the State of Michigan?
Total Immigrants from Hungary in Michigan is 873.
What is the Total Immigrants from Hungary in the United States?
Total Immigrants from Hungary in the United States is 64,894.