Cities with the Most Immigrants from Brazil in Ohio
RELATED REPORTS & OPTIONS
Brazil
Ohio
Compare Cities
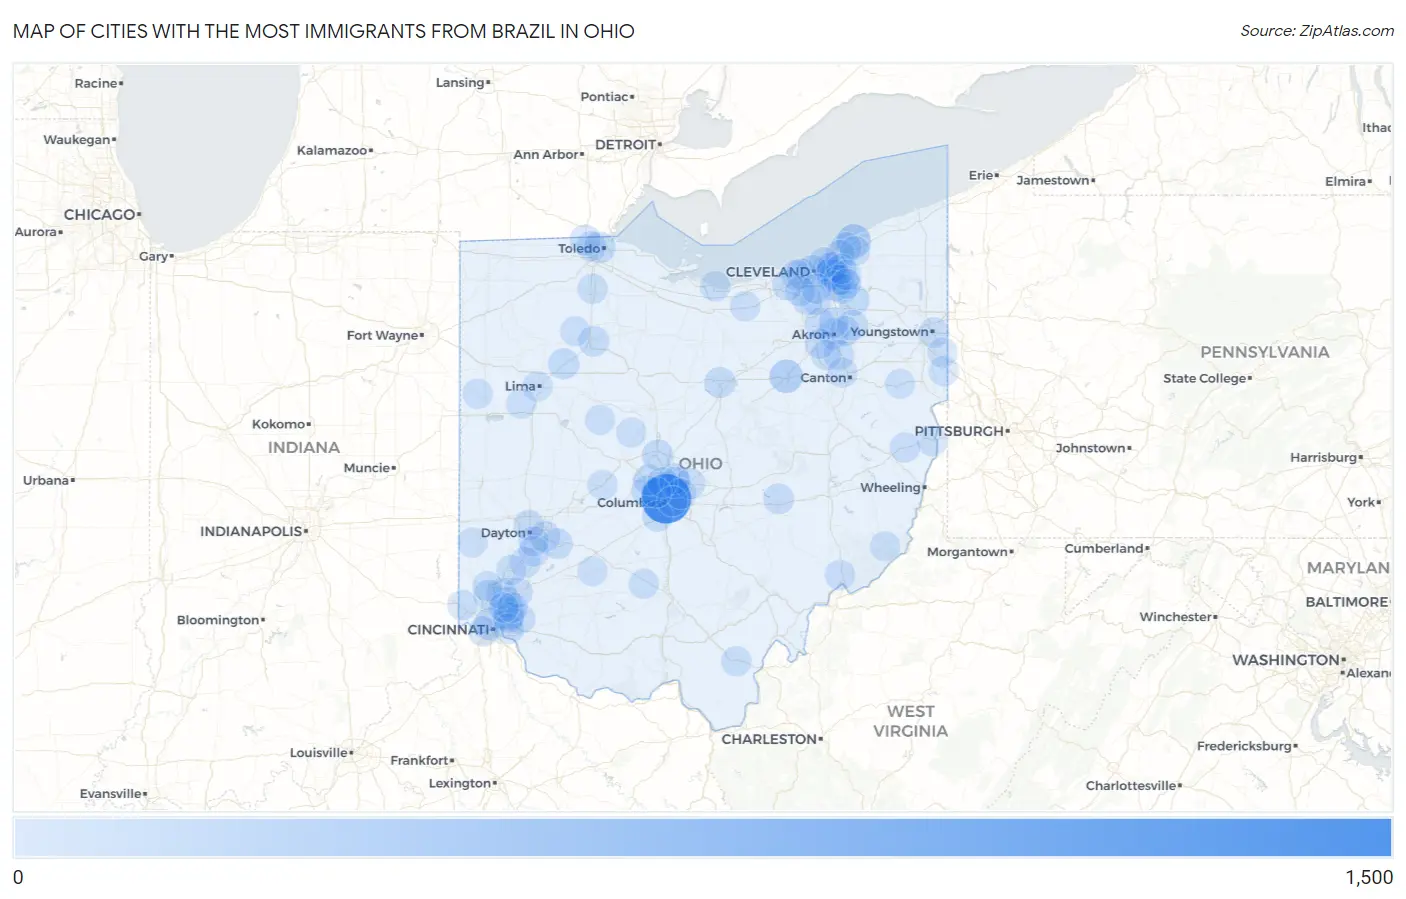
Map of Cities with the Most Immigrants from Brazil in Ohio
0
1,500
Cities with the Most Immigrants from Brazil in Ohio
| City | Brazil | vs State | vs National | |
| 1. | Columbus | 1,076 | 5,101(21.09%)#1 | 552,373(0.19%)#59 |
| 2. | Mentor | 215 | 5,101(4.21%)#2 | 552,373(0.04%)#371 |
| 3. | Wooster | 179 | 5,101(3.51%)#3 | 552,373(0.03%)#426 |
| 4. | Kenwood | 127 | 5,101(2.49%)#4 | 552,373(0.02%)#583 |
| 5. | Cincinnati | 105 | 5,101(2.06%)#5 | 552,373(0.02%)#680 |
| 6. | Cleveland | 98 | 5,101(1.92%)#6 | 552,373(0.02%)#712 |
| 7. | Hilliard | 79 | 5,101(1.55%)#7 | 552,373(0.01%)#835 |
| 8. | Aurora | 64 | 5,101(1.25%)#8 | 552,373(0.01%)#984 |
| 9. | Toledo | 61 | 5,101(1.20%)#9 | 552,373(0.01%)#1,014 |
| 10. | Shaker Heights | 57 | 5,101(1.12%)#10 | 552,373(0.01%)#1,074 |
| 11. | Bluffton | 56 | 5,101(1.10%)#11 | 552,373(0.01%)#1,097 |
| 12. | Dublin | 53 | 5,101(1.04%)#12 | 552,373(0.01%)#1,126 |
| 13. | Westerville | 53 | 5,101(1.04%)#13 | 552,373(0.01%)#1,128 |
| 14. | Cleveland Heights | 52 | 5,101(1.02%)#14 | 552,373(0.01%)#1,141 |
| 15. | Delaware | 52 | 5,101(1.02%)#15 | 552,373(0.01%)#1,142 |
| 16. | Mansfield | 46 | 5,101(0.90%)#16 | 552,373(0.01%)#1,230 |
| 17. | Huber Ridge | 45 | 5,101(0.88%)#17 | 552,373(0.01%)#1,257 |
| 18. | Springboro | 44 | 5,101(0.86%)#18 | 552,373(0.01%)#1,268 |
| 19. | Akron | 39 | 5,101(0.76%)#19 | 552,373(0.01%)#1,346 |
| 20. | Findlay | 39 | 5,101(0.76%)#20 | 552,373(0.01%)#1,350 |
| 21. | Xenia | 36 | 5,101(0.71%)#21 | 552,373(0.01%)#1,427 |
| 22. | Grove City | 35 | 5,101(0.69%)#22 | 552,373(0.01%)#1,452 |
| 23. | Sharonville | 34 | 5,101(0.67%)#23 | 552,373(0.01%)#1,488 |
| 24. | Sylvania | 33 | 5,101(0.65%)#24 | 552,373(0.01%)#1,524 |
| 25. | North Zanesville | 33 | 5,101(0.65%)#25 | 552,373(0.01%)#1,536 |
| 26. | Beavercreek | 32 | 5,101(0.63%)#26 | 552,373(0.01%)#1,546 |
| 27. | Beckett Ridge | 32 | 5,101(0.63%)#27 | 552,373(0.01%)#1,563 |
| 28. | North Olmsted | 29 | 5,101(0.57%)#28 | 552,373(0.01%)#1,634 |
| 29. | Fairfield | 28 | 5,101(0.55%)#29 | 552,373(0.01%)#1,662 |
| 30. | Willoughby | 28 | 5,101(0.55%)#30 | 552,373(0.01%)#1,670 |
| 31. | Milford | 28 | 5,101(0.55%)#31 | 552,373(0.01%)#1,684 |
| 32. | Montrose Ghent | 28 | 5,101(0.55%)#32 | 552,373(0.01%)#1,688 |
| 33. | Kent | 27 | 5,101(0.53%)#33 | 552,373(0.00%)#1,713 |
| 34. | University Heights | 25 | 5,101(0.49%)#34 | 552,373(0.00%)#1,797 |
| 35. | Moreland Hills | 24 | 5,101(0.47%)#35 | 552,373(0.00%)#1,846 |
| 36. | Lakewood | 23 | 5,101(0.45%)#36 | 552,373(0.00%)#1,858 |
| 37. | Rocky River | 23 | 5,101(0.45%)#37 | 552,373(0.00%)#1,864 |
| 38. | New Albany | 22 | 5,101(0.43%)#38 | 552,373(0.00%)#1,928 |
| 39. | Beachwood | 19 | 5,101(0.37%)#39 | 552,373(0.00%)#2,079 |
| 40. | Devola | 19 | 5,101(0.37%)#40 | 552,373(0.00%)#2,091 |
| 41. | Dayton | 18 | 5,101(0.35%)#41 | 552,373(0.00%)#2,099 |
| 42. | North Royalton | 18 | 5,101(0.35%)#42 | 552,373(0.00%)#2,110 |
| 43. | Centerville | 18 | 5,101(0.35%)#43 | 552,373(0.00%)#2,116 |
| 44. | Madeira | 18 | 5,101(0.35%)#44 | 552,373(0.00%)#2,134 |
| 45. | Gahanna | 17 | 5,101(0.33%)#45 | 552,373(0.00%)#2,170 |
| 46. | South Euclid | 17 | 5,101(0.33%)#46 | 552,373(0.00%)#2,179 |
| 47. | Mason | 16 | 5,101(0.31%)#47 | 552,373(0.00%)#2,220 |
| 48. | Broadview Heights | 16 | 5,101(0.31%)#48 | 552,373(0.00%)#2,228 |
| 49. | Worthington | 16 | 5,101(0.31%)#49 | 552,373(0.00%)#2,232 |
| 50. | Green | 15 | 5,101(0.29%)#50 | 552,373(0.00%)#2,283 |
| 51. | Bexley | 15 | 5,101(0.29%)#51 | 552,373(0.00%)#2,296 |
| 52. | Bowling Green | 14 | 5,101(0.27%)#52 | 552,373(0.00%)#2,363 |
| 53. | Steubenville | 14 | 5,101(0.27%)#53 | 552,373(0.00%)#2,374 |
| 54. | Huron | 14 | 5,101(0.27%)#54 | 552,373(0.00%)#2,397 |
| 55. | Turpin Hills | 14 | 5,101(0.27%)#55 | 552,373(0.00%)#2,399 |
| 56. | Hopedale | 14 | 5,101(0.27%)#56 | 552,373(0.00%)#2,421 |
| 57. | Rio Grande | 13 | 5,101(0.25%)#57 | 552,373(0.00%)#2,488 |
| 58. | Middletown | 12 | 5,101(0.24%)#58 | 552,373(0.00%)#2,497 |
| 59. | Upper Arlington | 12 | 5,101(0.24%)#59 | 552,373(0.00%)#2,504 |
| 60. | Tallmadge | 12 | 5,101(0.24%)#60 | 552,373(0.00%)#2,515 |
| 61. | Bedford Heights | 12 | 5,101(0.24%)#61 | 552,373(0.00%)#2,531 |
| 62. | Youngstown | 11 | 5,101(0.22%)#62 | 552,373(0.00%)#2,571 |
| 63. | Cuyahoga Falls | 11 | 5,101(0.22%)#63 | 552,373(0.00%)#2,572 |
| 64. | Harrison | 11 | 5,101(0.22%)#64 | 552,373(0.00%)#2,599 |
| 65. | Wickliffe | 11 | 5,101(0.22%)#65 | 552,373(0.00%)#2,601 |
| 66. | Ottawa Hills | 11 | 5,101(0.22%)#66 | 552,373(0.00%)#2,621 |
| 67. | Bratenahl | 11 | 5,101(0.22%)#67 | 552,373(0.00%)#2,641 |
| 68. | Frankfort | 11 | 5,101(0.22%)#68 | 552,373(0.00%)#2,642 |
| 69. | Hamilton | 10 | 5,101(0.20%)#69 | 552,373(0.00%)#2,655 |
| 70. | Kettering | 10 | 5,101(0.20%)#70 | 552,373(0.00%)#2,657 |
| 71. | Middleburg Heights | 10 | 5,101(0.20%)#71 | 552,373(0.00%)#2,685 |
| 72. | Delshire | 10 | 5,101(0.20%)#72 | 552,373(0.00%)#2,726 |
| 73. | Orange | 10 | 5,101(0.20%)#73 | 552,373(0.00%)#2,728 |
| 74. | New Franklin | 9 | 5,101(0.18%)#74 | 552,373(0.00%)#2,782 |
| 75. | Norton | 9 | 5,101(0.18%)#75 | 552,373(0.00%)#2,787 |
| 76. | Lima | 8 | 5,101(0.16%)#76 | 552,373(0.00%)#2,855 |
| 77. | Seven Hills | 8 | 5,101(0.16%)#77 | 552,373(0.00%)#2,881 |
| 78. | East Palestine | 8 | 5,101(0.16%)#78 | 552,373(0.00%)#2,903 |
| 79. | Lake Lakengren | 8 | 5,101(0.16%)#79 | 552,373(0.00%)#2,908 |
| 80. | Solon | 7 | 5,101(0.14%)#80 | 552,373(0.00%)#2,947 |
| 81. | Montgomery | 7 | 5,101(0.14%)#81 | 552,373(0.00%)#2,962 |
| 82. | Mechanicsburg | 7 | 5,101(0.14%)#82 | 552,373(0.00%)#3,002 |
| 83. | Mayfield Heights | 6 | 5,101(0.12%)#83 | 552,373(0.00%)#3,049 |
| 84. | Rockford | 6 | 5,101(0.12%)#84 | 552,373(0.00%)#3,110 |
| 85. | Evendale | 5 | 5,101(0.10%)#85 | 552,373(0.00%)#3,147 |
| 86. | Richwood | 5 | 5,101(0.10%)#86 | 552,373(0.00%)#3,155 |
| 87. | Kipton | 5 | 5,101(0.10%)#87 | 552,373(0.00%)#3,177 |
| 88. | Sabina | 4 | 5,101(0.08%)#88 | 552,373(0.00%)#3,231 |
| 89. | Hunting Valley | 4 | 5,101(0.08%)#89 | 552,373(0.00%)#3,264 |
| 90. | Kirtland Hills | 4 | 5,101(0.08%)#90 | 552,373(0.00%)#3,268 |
| 91. | Mccomb | 3 | 5,101(0.06%)#91 | 552,373(0.00%)#3,321 |
| 92. | Hanoverton | 3 | 5,101(0.06%)#92 | 552,373(0.00%)#3,356 |
| 93. | New Middletown | 2 | 5,101(0.04%)#93 | 552,373(0.00%)#3,394 |
| 94. | Buckland | 2 | 5,101(0.04%)#94 | 552,373(0.00%)#3,434 |
| 95. | Hills And Dales | 2 | 5,101(0.04%)#95 | 552,373(0.00%)#3,435 |
| 96. | Bentleyville | 1 | 5,101(0.02%)#96 | 552,373(0.00%)#3,476 |
| 97. | Ridgeway | 1 | 5,101(0.02%)#97 | 552,373(0.00%)#3,490 |
| 98. | Antioch | 1 | 5,101(0.02%)#98 | 552,373(0.00%)#3,500 |
Common Questions
What are the Top 10 Cities with the Most Immigrants from Brazil in Ohio?
Top 10 Cities with the Most Immigrants from Brazil in Ohio are:
#1
1,076
#2
215
#3
179
#4
127
#5
105
#6
98
#7
79
#8
64
#9
61
#10
57
What city has the Most Immigrants from Brazil in Ohio?
Columbus has the Most Immigrants from Brazil in Ohio with 1,076.
What is the Total Immigrants from Brazil in the State of Ohio?
Total Immigrants from Brazil in Ohio is 5,101.
What is the Total Immigrants from Brazil in the United States?
Total Immigrants from Brazil in the United States is 552,373.