Cities with the Most Immigrants from Brazil in Massachusetts
RELATED REPORTS & OPTIONS
Brazil
Massachusetts
Compare Cities
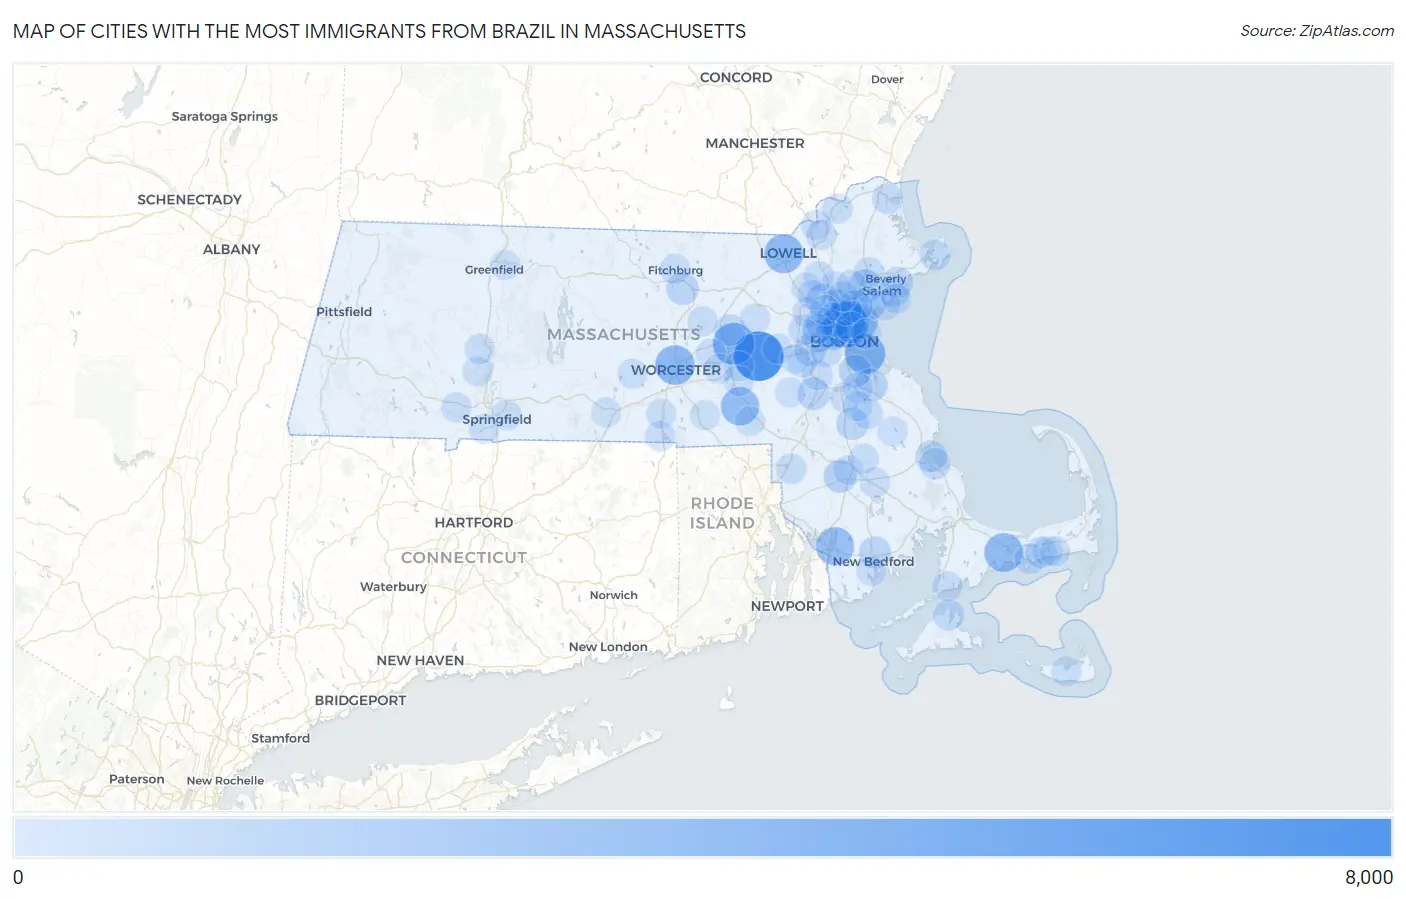
Map of Cities with the Most Immigrants from Brazil in Massachusetts
0
8,000
Cities with the Most Immigrants from Brazil in Massachusetts
| City | Brazil | vs State | vs National | |
| 1. | Framingham | 7,755 | 92,959(8.34%)#1 | 552,373(1.40%)#4 |
| 2. | Everett | 5,864 | 92,959(6.31%)#2 | 552,373(1.06%)#8 |
| 3. | Marlborough | 4,560 | 92,959(4.91%)#3 | 552,373(0.83%)#12 |
| 4. | Boston | 4,093 | 92,959(4.40%)#4 | 552,373(0.74%)#15 |
| 5. | Worcester | 3,691 | 92,959(3.97%)#5 | 552,373(0.67%)#18 |
| 6. | Malden | 3,678 | 92,959(3.96%)#6 | 552,373(0.67%)#19 |
| 7. | Barnstable Town | 3,471 | 92,959(3.73%)#7 | 552,373(0.63%)#21 |
| 8. | Lowell | 3,446 | 92,959(3.71%)#8 | 552,373(0.62%)#22 |
| 9. | Milford | 3,244 | 92,959(3.49%)#9 | 552,373(0.59%)#24 |
| 10. | Fall River | 3,139 | 92,959(3.38%)#10 | 552,373(0.57%)#26 |
| 11. | Revere | 2,386 | 92,959(2.57%)#11 | 552,373(0.43%)#30 |
| 12. | Somerville | 2,369 | 92,959(2.55%)#12 | 552,373(0.43%)#31 |
| 13. | Medford | 1,767 | 92,959(1.90%)#13 | 552,373(0.32%)#38 |
| 14. | Peabody | 1,489 | 92,959(1.60%)#14 | 552,373(0.27%)#45 |
| 15. | Lynn | 1,439 | 92,959(1.55%)#15 | 552,373(0.26%)#47 |
| 16. | Weymouth Town | 1,154 | 92,959(1.24%)#16 | 552,373(0.21%)#56 |
| 17. | Taunton | 1,120 | 92,959(1.20%)#17 | 552,373(0.20%)#57 |
| 18. | Woburn | 1,115 | 92,959(1.20%)#18 | 552,373(0.20%)#58 |
| 19. | Quincy | 989 | 92,959(1.06%)#19 | 552,373(0.18%)#64 |
| 20. | Norwood | 955 | 92,959(1.03%)#20 | 552,373(0.17%)#66 |
| 21. | Cambridge | 954 | 92,959(1.03%)#21 | 552,373(0.17%)#67 |
| 22. | Leominster | 941 | 92,959(1.01%)#22 | 552,373(0.17%)#68 |
| 23. | Saugus | 915 | 92,959(0.98%)#23 | 552,373(0.17%)#70 |
| 24. | Brockton | 850 | 92,959(0.91%)#24 | 552,373(0.15%)#79 |
| 25. | Newton | 812 | 92,959(0.87%)#25 | 552,373(0.15%)#87 |
| 26. | Watertown Town | 804 | 92,959(0.86%)#26 | 552,373(0.15%)#91 |
| 27. | New Bedford | 764 | 92,959(0.82%)#27 | 552,373(0.14%)#93 |
| 28. | Hudson | 705 | 92,959(0.76%)#28 | 552,373(0.13%)#100 |
| 29. | North Plymouth | 672 | 92,959(0.72%)#29 | 552,373(0.12%)#108 |
| 30. | Salem | 582 | 92,959(0.63%)#30 | 552,373(0.11%)#126 |
| 31. | Beverly | 557 | 92,959(0.60%)#31 | 552,373(0.10%)#132 |
| 32. | South Yarmouth | 552 | 92,959(0.59%)#32 | 552,373(0.10%)#134 |
| 33. | Stoneham | 547 | 92,959(0.59%)#33 | 552,373(0.10%)#138 |
| 34. | Chelsea | 489 | 92,959(0.53%)#34 | 552,373(0.09%)#159 |
| 35. | Plymouth | 469 | 92,959(0.50%)#35 | 552,373(0.08%)#168 |
| 36. | Brookline | 399 | 92,959(0.43%)#36 | 552,373(0.07%)#197 |
| 37. | Amherst | 387 | 92,959(0.42%)#37 | 552,373(0.07%)#207 |
| 38. | Vineyard Haven | 378 | 92,959(0.41%)#38 | 552,373(0.07%)#211 |
| 39. | Melrose | 339 | 92,959(0.36%)#39 | 552,373(0.06%)#232 |
| 40. | Gloucester | 329 | 92,959(0.35%)#40 | 552,373(0.06%)#237 |
| 41. | Danvers | 321 | 92,959(0.35%)#41 | 552,373(0.06%)#247 |
| 42. | Newburyport | 316 | 92,959(0.34%)#42 | 552,373(0.06%)#250 |
| 43. | Waltham | 296 | 92,959(0.32%)#43 | 552,373(0.05%)#271 |
| 44. | Attleboro | 280 | 92,959(0.30%)#44 | 552,373(0.05%)#281 |
| 45. | Abington | 272 | 92,959(0.29%)#45 | 552,373(0.05%)#292 |
| 46. | West Yarmouth | 255 | 92,959(0.27%)#46 | 552,373(0.05%)#310 |
| 47. | Dedham | 251 | 92,959(0.27%)#47 | 552,373(0.05%)#320 |
| 48. | Wakefield | 208 | 92,959(0.22%)#48 | 552,373(0.04%)#383 |
| 49. | Lexington | 193 | 92,959(0.21%)#49 | 552,373(0.03%)#405 |
| 50. | Swampscott | 190 | 92,959(0.20%)#50 | 552,373(0.03%)#410 |
| 51. | Northborough | 173 | 92,959(0.19%)#51 | 552,373(0.03%)#440 |
| 52. | Haverhill | 149 | 92,959(0.16%)#52 | 552,373(0.03%)#499 |
| 53. | Methuen Town | 148 | 92,959(0.16%)#53 | 552,373(0.03%)#503 |
| 54. | Braintree Town | 146 | 92,959(0.16%)#54 | 552,373(0.03%)#514 |
| 55. | Falmouth | 141 | 92,959(0.15%)#55 | 552,373(0.03%)#528 |
| 56. | Reading | 140 | 92,959(0.15%)#56 | 552,373(0.03%)#529 |
| 57. | Lawrence | 135 | 92,959(0.15%)#57 | 552,373(0.02%)#549 |
| 58. | Cochituate | 132 | 92,959(0.14%)#58 | 552,373(0.02%)#563 |
| 59. | Northampton | 120 | 92,959(0.13%)#59 | 552,373(0.02%)#623 |
| 60. | Clinton | 117 | 92,959(0.13%)#60 | 552,373(0.02%)#632 |
| 61. | Fitchburg | 111 | 92,959(0.12%)#61 | 552,373(0.02%)#660 |
| 62. | Maynard | 108 | 92,959(0.12%)#62 | 552,373(0.02%)#673 |
| 63. | Arlington | 106 | 92,959(0.11%)#63 | 552,373(0.02%)#676 |
| 64. | Middleborough Center | 104 | 92,959(0.11%)#64 | 552,373(0.02%)#686 |
| 65. | Westfield | 101 | 92,959(0.11%)#65 | 552,373(0.02%)#696 |
| 66. | Randolph Town | 99 | 92,959(0.11%)#66 | 552,373(0.02%)#708 |
| 67. | Lynnfield | 98 | 92,959(0.11%)#67 | 552,373(0.02%)#717 |
| 68. | Webster | 97 | 92,959(0.10%)#68 | 552,373(0.02%)#726 |
| 69. | Belmont | 93 | 92,959(0.10%)#69 | 552,373(0.02%)#748 |
| 70. | Springfield | 89 | 92,959(0.10%)#70 | 552,373(0.02%)#770 |
| 71. | Winchester | 84 | 92,959(0.09%)#71 | 552,373(0.02%)#801 |
| 72. | Winthrop Town | 83 | 92,959(0.09%)#72 | 552,373(0.02%)#810 |
| 73. | Bridgewater Town | 78 | 92,959(0.08%)#73 | 552,373(0.01%)#843 |
| 74. | Hopkinton | 71 | 92,959(0.08%)#74 | 552,373(0.01%)#917 |
| 75. | Wilmington | 69 | 92,959(0.07%)#75 | 552,373(0.01%)#940 |
| 76. | Oxford | 68 | 92,959(0.07%)#76 | 552,373(0.01%)#949 |
| 77. | Westborough | 66 | 92,959(0.07%)#77 | 552,373(0.01%)#965 |
| 78. | Nantucket | 59 | 92,959(0.06%)#78 | 552,373(0.01%)#1,044 |
| 79. | Oak Bluffs | 59 | 92,959(0.06%)#79 | 552,373(0.01%)#1,049 |
| 80. | Easthampton Town | 57 | 92,959(0.06%)#80 | 552,373(0.01%)#1,080 |
| 81. | Whitinsville | 55 | 92,959(0.06%)#81 | 552,373(0.01%)#1,106 |
| 82. | Needham | 54 | 92,959(0.06%)#82 | 552,373(0.01%)#1,113 |
| 83. | Spencer | 54 | 92,959(0.06%)#83 | 552,373(0.01%)#1,122 |
| 84. | Bellingham | 50 | 92,959(0.05%)#84 | 552,373(0.01%)#1,173 |
| 85. | Burlington | 49 | 92,959(0.05%)#85 | 552,373(0.01%)#1,183 |
| 86. | Pinehurst | 46 | 92,959(0.05%)#86 | 552,373(0.01%)#1,239 |
| 87. | Cordaville | 46 | 92,959(0.05%)#87 | 552,373(0.01%)#1,243 |
| 88. | Hanson | 45 | 92,959(0.05%)#88 | 552,373(0.01%)#1,259 |
| 89. | West Dennis | 38 | 92,959(0.04%)#89 | 552,373(0.01%)#1,389 |
| 90. | Raynham Center | 36 | 92,959(0.04%)#90 | 552,373(0.01%)#1,439 |
| 91. | Marblehead | 33 | 92,959(0.04%)#91 | 552,373(0.01%)#1,522 |
| 92. | Wellesley | 32 | 92,959(0.03%)#92 | 552,373(0.01%)#1,548 |
| 93. | Holbrook | 32 | 92,959(0.03%)#93 | 552,373(0.01%)#1,560 |
| 94. | Bliss Corner | 32 | 92,959(0.03%)#94 | 552,373(0.01%)#1,568 |
| 95. | Agawam Town | 29 | 92,959(0.03%)#95 | 552,373(0.01%)#1,636 |
| 96. | Dennis Port | 29 | 92,959(0.03%)#96 | 552,373(0.01%)#1,652 |
| 97. | Fiskdale | 28 | 92,959(0.03%)#97 | 552,373(0.01%)#1,692 |
| 98. | Greenfield | 26 | 92,959(0.03%)#98 | 552,373(0.00%)#1,749 |
| 99. | Medfield | 26 | 92,959(0.03%)#99 | 552,373(0.00%)#1,768 |
| 100. | Turners Falls | 26 | 92,959(0.03%)#100 | 552,373(0.00%)#1,775 |
Common Questions
What are the Top 10 Cities with the Most Immigrants from Brazil in Massachusetts?
Top 10 Cities with the Most Immigrants from Brazil in Massachusetts are:
#1
7,755
#2
5,864
#3
4,560
#4
4,093
#5
3,691
#6
3,678
#7
3,471
#8
3,446
#9
3,244
#10
3,139
What city has the Most Immigrants from Brazil in Massachusetts?
Framingham has the Most Immigrants from Brazil in Massachusetts with 7,755.
What is the Total Immigrants from Brazil in the State of Massachusetts?
Total Immigrants from Brazil in Massachusetts is 92,959.
What is the Total Immigrants from Brazil in the United States?
Total Immigrants from Brazil in the United States is 552,373.