Cities with the Most Immigrants from Brazil in Kansas
RELATED REPORTS & OPTIONS
Brazil
Kansas
Compare Cities
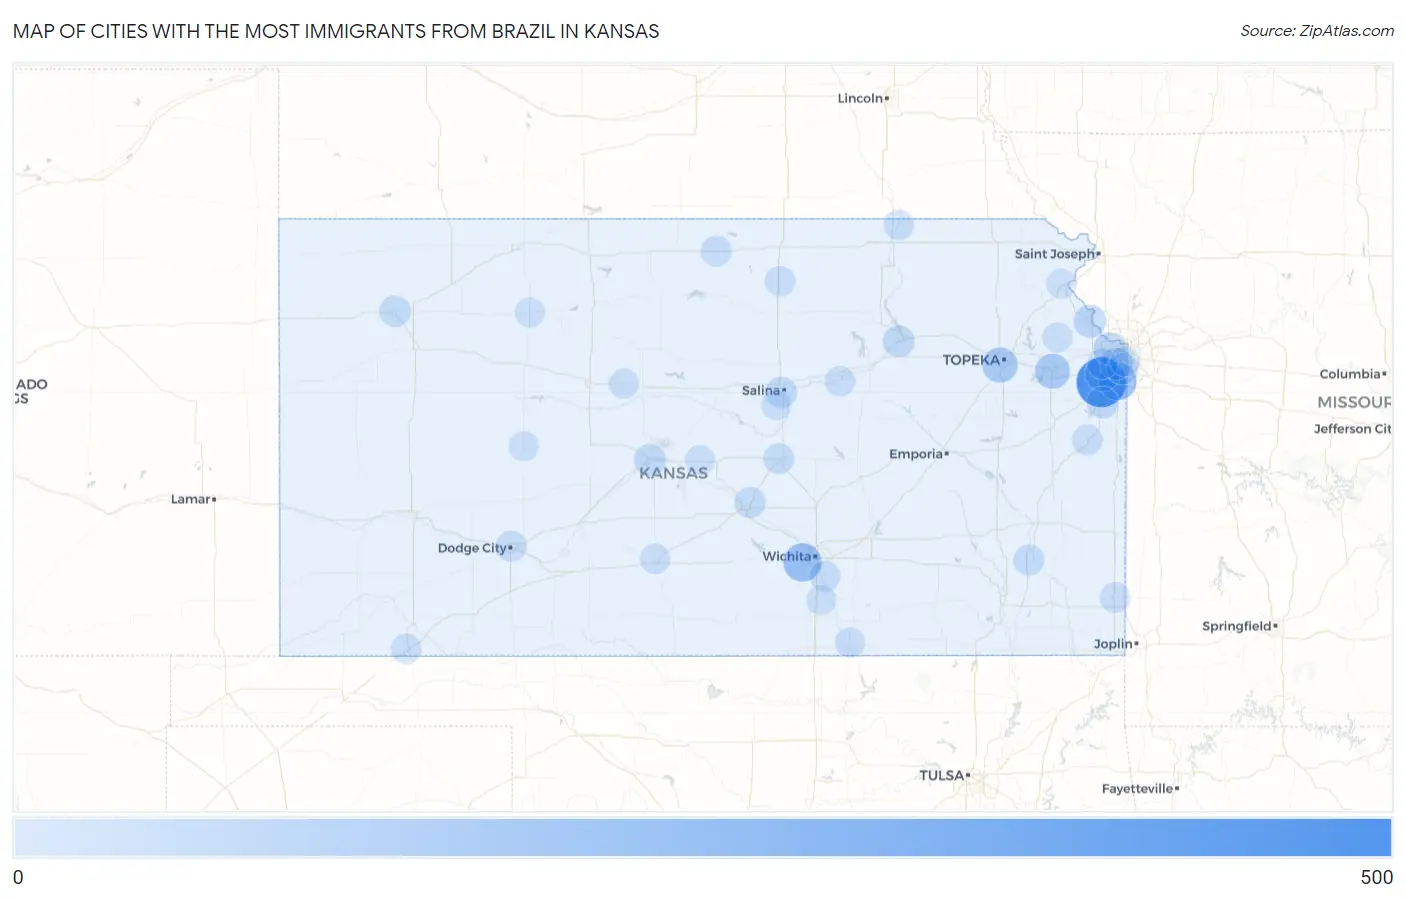
Map of Cities with the Most Immigrants from Brazil in Kansas
0
500
Cities with the Most Immigrants from Brazil in Kansas
| City | Brazil | vs State | vs National | |
| 1. | Olathe | 472 | 1,963(24.04%)#1 | 552,373(0.09%)#166 |
| 2. | Wichita | 192 | 1,963(9.78%)#2 | 552,373(0.03%)#406 |
| 3. | Overland Park | 185 | 1,963(9.42%)#3 | 552,373(0.03%)#413 |
| 4. | Topeka | 120 | 1,963(6.11%)#4 | 552,373(0.02%)#618 |
| 5. | Lawrence | 115 | 1,963(5.86%)#5 | 552,373(0.02%)#637 |
| 6. | Lenexa | 115 | 1,963(5.86%)#6 | 552,373(0.02%)#640 |
| 7. | Kansas City | 66 | 1,963(3.36%)#7 | 552,373(0.01%)#954 |
| 8. | Leavenworth | 58 | 1,963(2.95%)#8 | 552,373(0.01%)#1,053 |
| 9. | Merriam | 48 | 1,963(2.45%)#9 | 552,373(0.01%)#1,204 |
| 10. | Manhattan | 38 | 1,963(1.94%)#10 | 552,373(0.01%)#1,369 |
| 11. | Great Bend | 38 | 1,963(1.94%)#11 | 552,373(0.01%)#1,380 |
| 12. | Spring Hill | 37 | 1,963(1.88%)#12 | 552,373(0.01%)#1,411 |
| 13. | Salina | 31 | 1,963(1.58%)#13 | 552,373(0.01%)#1,576 |
| 14. | Colby | 30 | 1,963(1.53%)#14 | 552,373(0.01%)#1,626 |
| 15. | Prairie Village | 29 | 1,963(1.48%)#15 | 552,373(0.01%)#1,639 |
| 16. | Hutchinson | 24 | 1,963(1.22%)#16 | 552,373(0.00%)#1,820 |
| 17. | Chanute | 21 | 1,963(1.07%)#17 | 552,373(0.00%)#1,976 |
| 18. | Mcpherson | 20 | 1,963(1.02%)#18 | 552,373(0.00%)#2,021 |
| 19. | Dodge City | 19 | 1,963(0.97%)#19 | 552,373(0.00%)#2,064 |
| 20. | Mankato | 18 | 1,963(0.92%)#20 | 552,373(0.00%)#2,159 |
| 21. | Derby | 15 | 1,963(0.76%)#21 | 552,373(0.00%)#2,285 |
| 22. | Osawatomie | 15 | 1,963(0.76%)#22 | 552,373(0.00%)#2,331 |
| 23. | Shawnee | 10 | 1,963(0.51%)#23 | 552,373(0.00%)#2,654 |
| 24. | Enterprise | 9 | 1,963(0.46%)#24 | 552,373(0.00%)#2,842 |
| 25. | Pittsburg | 8 | 1,963(0.41%)#25 | 552,373(0.00%)#2,868 |
| 26. | Pratt | 7 | 1,963(0.36%)#26 | 552,373(0.00%)#2,970 |
| 27. | Liberal | 6 | 1,963(0.31%)#27 | 552,373(0.00%)#3,050 |
| 28. | Concordia | 6 | 1,963(0.31%)#28 | 552,373(0.00%)#3,076 |
| 29. | Arkansas City | 4 | 1,963(0.20%)#29 | 552,373(0.00%)#3,201 |
| 30. | Gorham | 4 | 1,963(0.20%)#30 | 552,373(0.00%)#3,273 |
| 31. | Oketo | 4 | 1,963(0.20%)#31 | 552,373(0.00%)#3,277 |
| 32. | Hill City | 3 | 1,963(0.15%)#32 | 552,373(0.00%)#3,317 |
| 33. | Ness City | 3 | 1,963(0.15%)#33 | 552,373(0.00%)#3,330 |
| 34. | Mclouth | 3 | 1,963(0.15%)#34 | 552,373(0.00%)#3,335 |
| 35. | Atchison | 2 | 1,963(0.10%)#35 | 552,373(0.00%)#3,372 |
| 36. | Belle Plaine | 2 | 1,963(0.10%)#36 | 552,373(0.00%)#3,393 |
| 37. | Chase | 2 | 1,963(0.10%)#37 | 552,373(0.00%)#3,423 |
| 38. | Smolan | 1 | 1,963(0.05%)#38 | 552,373(0.00%)#3,497 |
| 39. | Mission Woods | 1 | 1,963(0.05%)#39 | 552,373(0.00%)#3,498 |
Common Questions
What are the Top 10 Cities with the Most Immigrants from Brazil in Kansas?
Top 10 Cities with the Most Immigrants from Brazil in Kansas are:
#1
472
#2
192
#3
185
#4
120
#5
115
#6
115
#7
66
#8
58
#9
48
#10
38
What city has the Most Immigrants from Brazil in Kansas?
Olathe has the Most Immigrants from Brazil in Kansas with 472.
What is the Total Immigrants from Brazil in the State of Kansas?
Total Immigrants from Brazil in Kansas is 1,963.
What is the Total Immigrants from Brazil in the United States?
Total Immigrants from Brazil in the United States is 552,373.