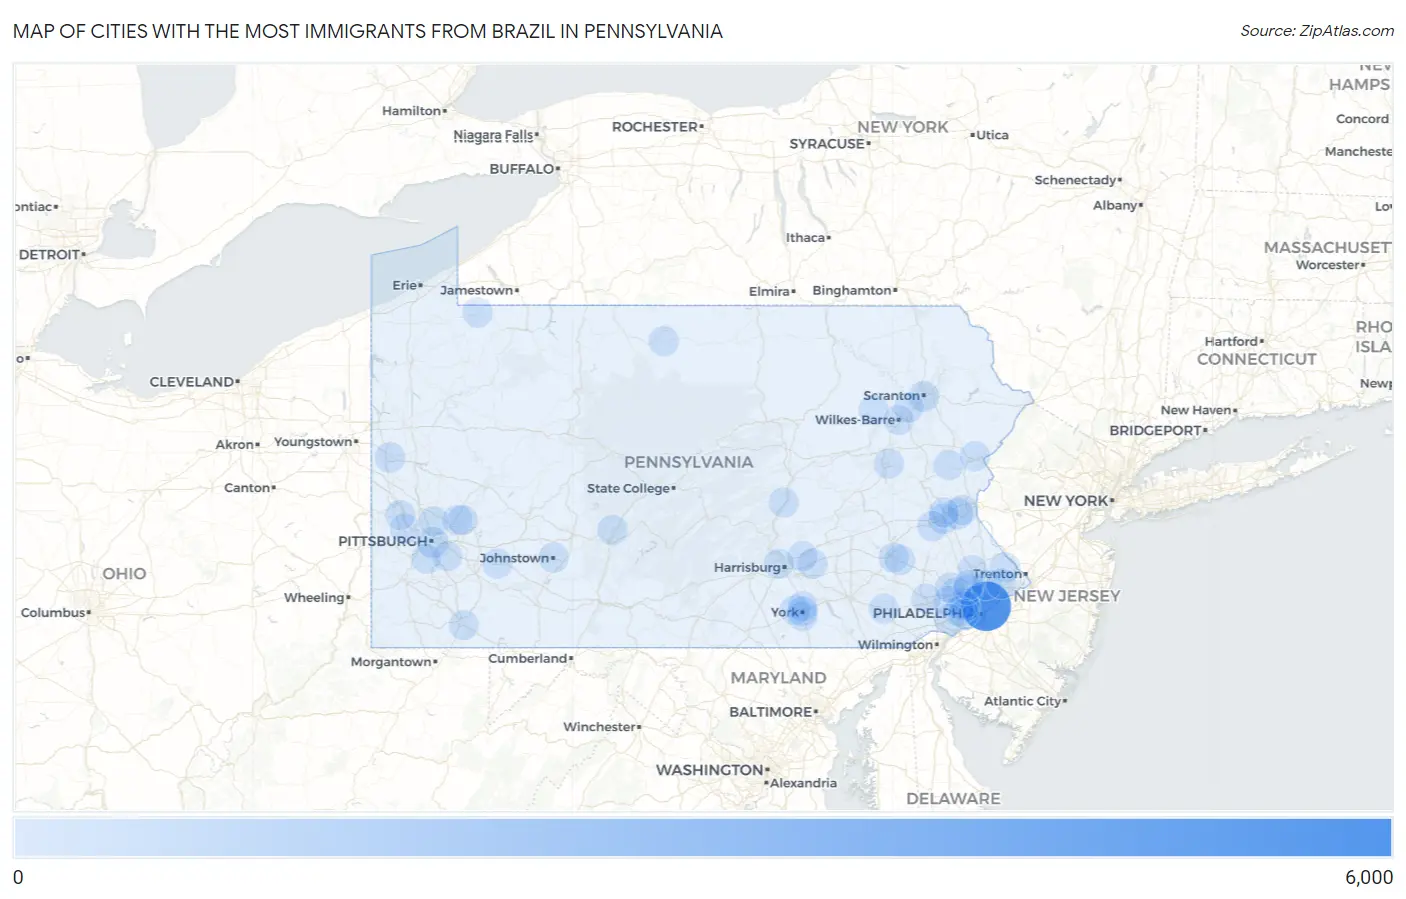
Cities with the Most Immigrants from Brazil in Pennsylvania
RELATED REPORTS & OPTIONS
Brazil
Pennsylvania
Compare Cities
Map of Cities with the Most Immigrants from Brazil in Pennsylvania
0
6,000
Cities with the Most Immigrants from Brazil in Pennsylvania
| City | Brazil | vs State | vs National | |
| 1. | Philadelphia | 5,725 | 13,077(43.78%)#1 | 552,373(1.04%)#9 |
| 2. | Pittsburgh | 389 | 13,077(2.97%)#2 | 552,373(0.07%)#203 |
| 3. | Bethlehem | 313 | 13,077(2.39%)#3 | 552,373(0.06%)#252 |
| 4. | Phoenixville Borough | 254 | 13,077(1.94%)#4 | 552,373(0.05%)#313 |
| 5. | Scranton | 205 | 13,077(1.57%)#5 | 552,373(0.04%)#385 |
| 6. | New Castle | 102 | 13,077(0.78%)#6 | 552,373(0.02%)#693 |
| 7. | Allentown | 85 | 13,077(0.65%)#7 | 552,373(0.02%)#786 |
| 8. | Bryn Mawr | 84 | 13,077(0.64%)#8 | 552,373(0.02%)#805 |
| 9. | Ancient Oaks | 82 | 13,077(0.63%)#9 | 552,373(0.01%)#820 |
| 10. | Bridgeport Borough | 70 | 13,077(0.54%)#10 | 552,373(0.01%)#932 |
| 11. | West View Borough | 63 | 13,077(0.48%)#11 | 552,373(0.01%)#997 |
| 12. | Willow Grove | 62 | 13,077(0.47%)#12 | 552,373(0.01%)#1,009 |
| 13. | King Of Prussia | 57 | 13,077(0.44%)#13 | 552,373(0.01%)#1,075 |
| 14. | Conshohocken Borough | 52 | 13,077(0.40%)#14 | 552,373(0.01%)#1,149 |
| 15. | Trevose | 50 | 13,077(0.38%)#15 | 552,373(0.01%)#1,174 |
| 16. | Old Forge Borough | 44 | 13,077(0.34%)#16 | 552,373(0.01%)#1,273 |
| 17. | Berwyn | 43 | 13,077(0.33%)#17 | 552,373(0.01%)#1,291 |
| 18. | Grantley | 39 | 13,077(0.30%)#18 | 552,373(0.01%)#1,363 |
| 19. | Shiloh | 38 | 13,077(0.29%)#19 | 552,373(0.01%)#1,385 |
| 20. | Ardmore | 37 | 13,077(0.28%)#20 | 552,373(0.01%)#1,406 |
| 21. | Hershey | 36 | 13,077(0.28%)#21 | 552,373(0.01%)#1,433 |
| 22. | Reiffton | 36 | 13,077(0.28%)#22 | 552,373(0.01%)#1,442 |
| 23. | Merion Station | 34 | 13,077(0.26%)#23 | 552,373(0.01%)#1,499 |
| 24. | Adamstown Borough | 34 | 13,077(0.26%)#24 | 552,373(0.01%)#1,506 |
| 25. | Altoona | 33 | 13,077(0.25%)#25 | 552,373(0.01%)#1,514 |
| 26. | Skyline View | 32 | 13,077(0.24%)#26 | 552,373(0.01%)#1,570 |
| 27. | Johnstown | 31 | 13,077(0.24%)#27 | 552,373(0.01%)#1,588 |
| 28. | Clarks Summit Borough | 31 | 13,077(0.24%)#28 | 552,373(0.01%)#1,598 |
| 29. | Columbus | 31 | 13,077(0.24%)#29 | 552,373(0.01%)#1,604 |
| 30. | Port Trevorton | 31 | 13,077(0.24%)#30 | 552,373(0.01%)#1,605 |
| 31. | White Oak Borough | 30 | 13,077(0.23%)#31 | 552,373(0.01%)#1,619 |
| 32. | Wayne | 30 | 13,077(0.23%)#32 | 552,373(0.01%)#1,621 |
| 33. | Effort | 26 | 13,077(0.20%)#33 | 552,373(0.00%)#1,778 |
| 34. | Lansdowne Borough | 25 | 13,077(0.19%)#34 | 552,373(0.00%)#1,799 |
| 35. | Broomall | 24 | 13,077(0.18%)#35 | 552,373(0.00%)#1,833 |
| 36. | Mckeesport | 23 | 13,077(0.18%)#36 | 552,373(0.00%)#1,869 |
| 37. | Hatboro Borough | 23 | 13,077(0.18%)#37 | 552,373(0.00%)#1,885 |
| 38. | Middletown | 21 | 13,077(0.16%)#38 | 552,373(0.00%)#1,978 |
| 39. | Prospect Park Borough | 20 | 13,077(0.15%)#39 | 552,373(0.00%)#2,036 |
| 40. | Hazleton | 19 | 13,077(0.15%)#40 | 552,373(0.00%)#2,062 |
| 41. | Coraopolis Borough | 18 | 13,077(0.14%)#41 | 552,373(0.00%)#2,141 |
| 42. | Newtown Grant | 17 | 13,077(0.13%)#42 | 552,373(0.00%)#2,195 |
| 43. | Manheim Borough | 17 | 13,077(0.13%)#43 | 552,373(0.00%)#2,199 |
| 44. | Arlington Heights | 16 | 13,077(0.12%)#44 | 552,373(0.00%)#2,248 |
| 45. | Enola | 16 | 13,077(0.12%)#45 | 552,373(0.00%)#2,249 |
| 46. | Arnold | 16 | 13,077(0.12%)#46 | 552,373(0.00%)#2,253 |
| 47. | Emigsville | 16 | 13,077(0.12%)#47 | 552,373(0.00%)#2,256 |
| 48. | Topton Borough | 16 | 13,077(0.12%)#48 | 552,373(0.00%)#2,263 |
| 49. | Chambersburg Borough | 15 | 13,077(0.11%)#49 | 552,373(0.00%)#2,288 |
| 50. | Dunmore Borough | 15 | 13,077(0.11%)#50 | 552,373(0.00%)#2,295 |
| 51. | Audubon | 15 | 13,077(0.11%)#51 | 552,373(0.00%)#2,308 |
| 52. | Ambler Borough | 15 | 13,077(0.11%)#52 | 552,373(0.00%)#2,322 |
| 53. | North East Borough | 15 | 13,077(0.11%)#53 | 552,373(0.00%)#2,332 |
| 54. | Duncansville Borough | 15 | 13,077(0.11%)#54 | 552,373(0.00%)#2,348 |
| 55. | Fox Chapel Borough | 14 | 13,077(0.11%)#55 | 552,373(0.00%)#2,403 |
| 56. | Royersford Borough | 14 | 13,077(0.11%)#56 | 552,373(0.00%)#2,407 |
| 57. | West Grove Borough | 14 | 13,077(0.11%)#57 | 552,373(0.00%)#2,412 |
| 58. | Souderton Borough | 13 | 13,077(0.10%)#58 | 552,373(0.00%)#2,469 |
| 59. | Plymouth Meeting | 13 | 13,077(0.10%)#59 | 552,373(0.00%)#2,471 |
| 60. | Avalon Borough | 13 | 13,077(0.10%)#60 | 552,373(0.00%)#2,475 |
| 61. | St Vincent College | 13 | 13,077(0.10%)#61 | 552,373(0.00%)#2,485 |
| 62. | Glassport Borough | 12 | 13,077(0.09%)#62 | 552,373(0.00%)#2,549 |
| 63. | Churchill Borough | 12 | 13,077(0.09%)#63 | 552,373(0.00%)#2,556 |
| 64. | Emsworth Borough | 12 | 13,077(0.09%)#64 | 552,373(0.00%)#2,559 |
| 65. | York | 11 | 13,077(0.08%)#65 | 552,373(0.00%)#2,573 |
| 66. | Carnot Moon | 11 | 13,077(0.08%)#66 | 552,373(0.00%)#2,596 |
| 67. | Gettysburg Borough | 11 | 13,077(0.08%)#67 | 552,373(0.00%)#2,611 |
| 68. | Mount Oliver Borough | 11 | 13,077(0.08%)#68 | 552,373(0.00%)#2,627 |
| 69. | Swedeland | 11 | 13,077(0.08%)#69 | 552,373(0.00%)#2,636 |
| 70. | Lower Burrell | 10 | 13,077(0.08%)#70 | 552,373(0.00%)#2,697 |
| 71. | Glenolden Borough | 10 | 13,077(0.08%)#71 | 552,373(0.00%)#2,709 |
| 72. | Yardley Borough | 10 | 13,077(0.08%)#72 | 552,373(0.00%)#2,737 |
| 73. | Pikes Creek | 10 | 13,077(0.08%)#73 | 552,373(0.00%)#2,749 |
| 74. | Fullerton | 9 | 13,077(0.07%)#74 | 552,373(0.00%)#2,775 |
| 75. | Morrisville Borough | 9 | 13,077(0.07%)#75 | 552,373(0.00%)#2,790 |
| 76. | Swissvale Borough | 9 | 13,077(0.07%)#76 | 552,373(0.00%)#2,794 |
| 77. | Pittston | 9 | 13,077(0.07%)#77 | 552,373(0.00%)#2,799 |
| 78. | Forest Hills Borough | 9 | 13,077(0.07%)#78 | 552,373(0.00%)#2,804 |
| 79. | Cornwall Borough | 9 | 13,077(0.07%)#79 | 552,373(0.00%)#2,815 |
| 80. | Newell Borough | 9 | 13,077(0.07%)#80 | 552,373(0.00%)#2,845 |
| 81. | Bethel Park | 8 | 13,077(0.06%)#81 | 552,373(0.00%)#2,856 |
| 82. | Aliquippa | 8 | 13,077(0.06%)#82 | 552,373(0.00%)#2,888 |
| 83. | Lionville | 8 | 13,077(0.06%)#83 | 552,373(0.00%)#2,898 |
| 84. | Sweden Valley | 8 | 13,077(0.06%)#84 | 552,373(0.00%)#2,930 |
| 85. | Reading | 7 | 13,077(0.05%)#85 | 552,373(0.00%)#2,932 |
| 86. | Allison Park | 7 | 13,077(0.05%)#86 | 552,373(0.00%)#2,949 |
| 87. | Montgomeryville | 7 | 13,077(0.05%)#87 | 552,373(0.00%)#2,957 |
| 88. | Blue Bell | 7 | 13,077(0.05%)#88 | 552,373(0.00%)#2,971 |
| 89. | Kenhorst Borough | 7 | 13,077(0.05%)#89 | 552,373(0.00%)#2,984 |
| 90. | East Lansdowne Borough | 7 | 13,077(0.05%)#90 | 552,373(0.00%)#2,988 |
| 91. | North York Borough | 7 | 13,077(0.05%)#91 | 552,373(0.00%)#2,993 |
| 92. | Gap | 7 | 13,077(0.05%)#92 | 552,373(0.00%)#2,995 |
| 93. | Laflin Borough | 7 | 13,077(0.05%)#93 | 552,373(0.00%)#3,009 |
| 94. | Mohnton Borough | 6 | 13,077(0.05%)#94 | 552,373(0.00%)#3,087 |
| 95. | Dallas Borough | 5 | 13,077(0.04%)#95 | 552,373(0.00%)#3,146 |
| 96. | Lima | 5 | 13,077(0.04%)#96 | 552,373(0.00%)#3,148 |
| 97. | Alburtis Borough | 5 | 13,077(0.04%)#97 | 552,373(0.00%)#3,149 |
| 98. | Hopwood | 5 | 13,077(0.04%)#98 | 552,373(0.00%)#3,158 |
| 99. | Wilkes Barre | 4 | 13,077(0.03%)#99 | 552,373(0.00%)#3,182 |
| 100. | Drexel Hill | 4 | 13,077(0.03%)#100 | 552,373(0.00%)#3,185 |
Common Questions
What are the Top 10 Cities with the Most Immigrants from Brazil in Pennsylvania?
Top 10 Cities with the Most Immigrants from Brazil in Pennsylvania are:
#1
5,725
#2
389
#3
313
#4
205
#5
102
#6
85
#7
84
#8
82
#9
62
#10
57
What city has the Most Immigrants from Brazil in Pennsylvania?
Philadelphia has the Most Immigrants from Brazil in Pennsylvania with 5,725.
What is the Total Immigrants from Brazil in the State of Pennsylvania?
Total Immigrants from Brazil in Pennsylvania is 13,077.
What is the Total Immigrants from Brazil in the United States?
Total Immigrants from Brazil in the United States is 552,373.