Zip Codes with the Highest Percentage of Population with a Degree in Bio, Nature & Agricultural in New Jersey
RELATED REPORTS & OPTIONS
Bio, Nature & Agricultural
New Jersey
Compare Zip Codes
Map of Zip Codes with the Highest Percentage of Population with a Degree in Bio, Nature & Agricultural in New Jersey
0.0%
100.0%
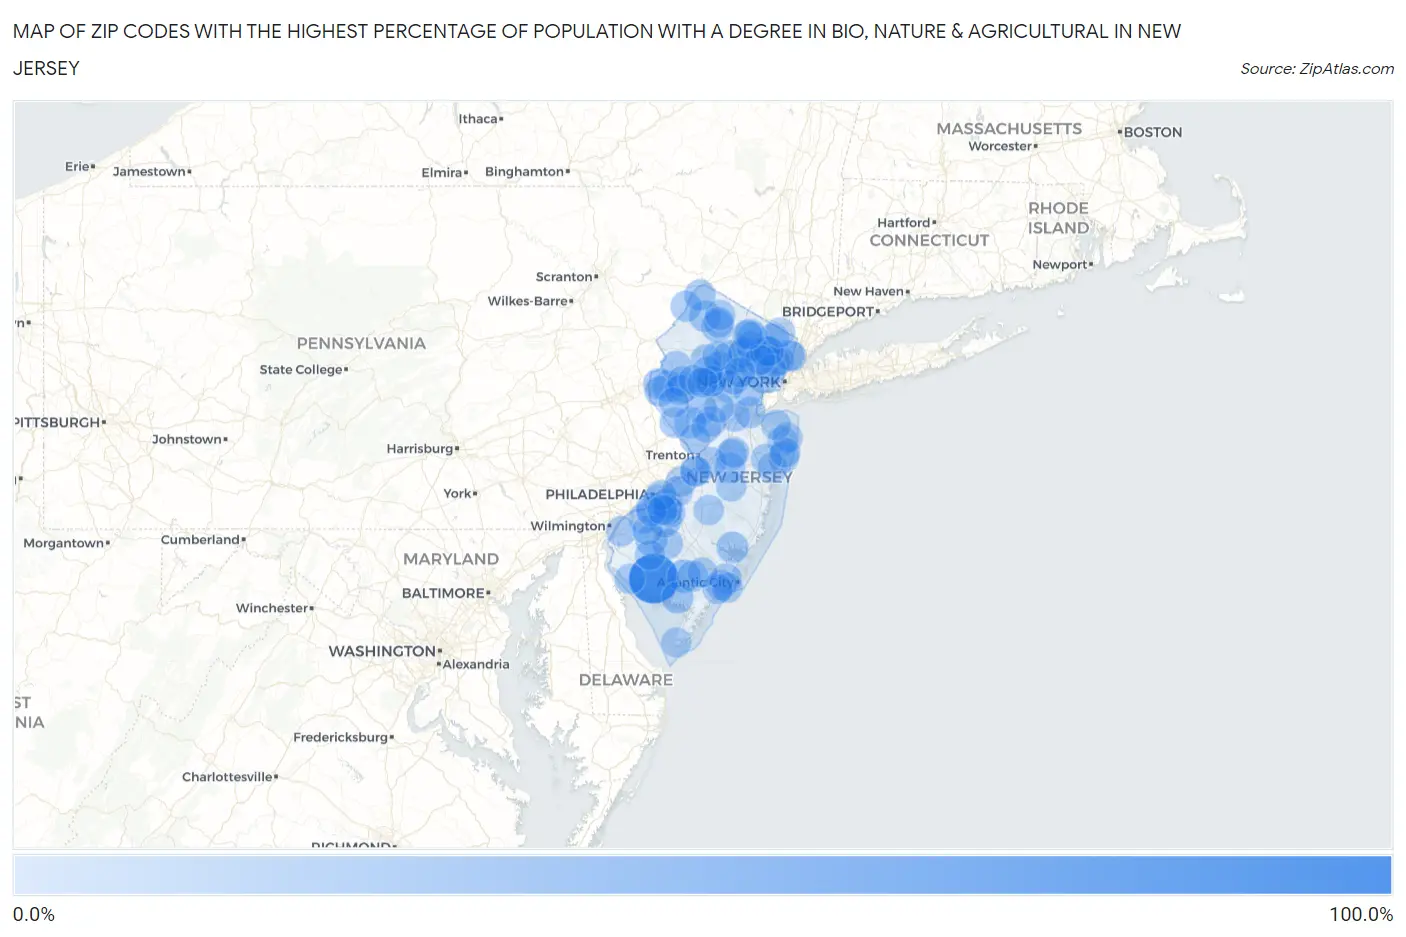
Zip Codes with the Highest Percentage of Population with a Degree in Bio, Nature & Agricultural in New Jersey
| Zip Code | % Graduates | vs State | vs National | |
| 1. | 08320 | 100.0% | 5.2% (+94.8)#1 | 6.4% (+93.6)#5 |
| 2. | 07878 | 29.3% | 5.2% (+24.0)#2 | 6.4% (+22.9)#1,141 |
| 3. | 08340 | 22.0% | 5.2% (+16.8)#3 | 6.4% (+15.7)#2,085 |
| 4. | 08032 | 20.0% | 5.2% (+14.8)#4 | 6.4% (+13.6)#2,552 |
| 5. | 07505 | 18.4% | 5.2% (+13.2)#5 | 6.4% (+12.0)#2,958 |
| 6. | 07970 | 17.3% | 5.2% (+12.0)#6 | 6.4% (+10.9)#3,338 |
| 7. | 07439 | 16.8% | 5.2% (+11.6)#7 | 6.4% (+10.5)#3,482 |
| 8. | 08327 | 15.7% | 5.2% (+10.5)#8 | 6.4% (+9.34)#3,927 |
| 9. | 08802 | 15.3% | 5.2% (+10.1)#9 | 6.4% (+8.99)#4,089 |
| 10. | 08343 | 15.3% | 5.2% (+10.1)#10 | 6.4% (+8.95)#4,101 |
| 11. | 08224 | 15.2% | 5.2% (+9.92)#11 | 6.4% (+8.80)#4,176 |
| 12. | 07977 | 15.1% | 5.2% (+9.83)#12 | 6.4% (+8.72)#4,209 |
| 13. | 07034 | 14.9% | 5.2% (+9.70)#13 | 6.4% (+8.58)#4,285 |
| 14. | 07822 | 14.1% | 5.2% (+8.83)#14 | 6.4% (+7.71)#4,740 |
| 15. | 07103 | 13.9% | 5.2% (+8.69)#15 | 6.4% (+7.57)#4,813 |
| 16. | 08551 | 13.8% | 5.2% (+8.54)#16 | 6.4% (+7.42)#4,914 |
| 17. | 07946 | 13.2% | 5.2% (+7.96)#17 | 6.4% (+6.84)#5,261 |
| 18. | 07935 | 12.7% | 5.2% (+7.51)#18 | 6.4% (+6.39)#5,566 |
| 19. | 07827 | 12.5% | 5.2% (+7.22)#19 | 6.4% (+6.11)#5,804 |
| 20. | 07851 | 12.4% | 5.2% (+7.18)#20 | 6.4% (+6.06)#5,825 |
| 21. | 08832 | 12.2% | 5.2% (+6.99)#21 | 6.4% (+5.88)#5,967 |
| 22. | 07836 | 12.1% | 5.2% (+6.88)#22 | 6.4% (+5.76)#6,057 |
| 23. | 07631 | 11.8% | 5.2% (+6.57)#23 | 6.4% (+5.45)#6,314 |
| 24. | 08555 | 11.5% | 5.2% (+6.29)#24 | 6.4% (+5.17)#6,555 |
| 25. | 08322 | 11.5% | 5.2% (+6.27)#25 | 6.4% (+5.15)#6,575 |
| 26. | 08317 | 11.4% | 5.2% (+6.21)#26 | 6.4% (+5.09)#6,627 |
| 27. | 08853 | 11.2% | 5.2% (+6.01)#27 | 6.4% (+4.90)#6,812 |
| 28. | 07608 | 11.1% | 5.2% (+5.88)#28 | 6.4% (+4.76)#6,976 |
| 29. | 08886 | 11.0% | 5.2% (+5.78)#29 | 6.4% (+4.66)#7,053 |
| 30. | 08829 | 10.8% | 5.2% (+5.60)#30 | 6.4% (+4.48)#7,223 |
| 31. | 07423 | 10.7% | 5.2% (+5.49)#31 | 6.4% (+4.37)#7,333 |
| 32. | 08063 | 10.7% | 5.2% (+5.43)#32 | 6.4% (+4.32)#7,407 |
| 33. | 07045 | 10.5% | 5.2% (+5.29)#33 | 6.4% (+4.17)#7,537 |
| 34. | 07442 | 10.5% | 5.2% (+5.24)#34 | 6.4% (+4.13)#7,602 |
| 35. | 08232 | 10.4% | 5.2% (+5.14)#35 | 6.4% (+4.03)#7,709 |
| 36. | 08559 | 10.3% | 5.2% (+5.04)#36 | 6.4% (+3.92)#7,815 |
| 37. | 07934 | 10.2% | 5.2% (+4.97)#37 | 6.4% (+3.85)#7,896 |
| 38. | 08901 | 10.1% | 5.2% (+4.86)#38 | 6.4% (+3.74)#8,010 |
| 39. | 08056 | 10.1% | 5.2% (+4.83)#39 | 6.4% (+3.71)#8,042 |
| 40. | 08514 | 10.1% | 5.2% (+4.82)#40 | 6.4% (+3.70)#8,055 |
| 41. | 08804 | 10.0% | 5.2% (+4.81)#41 | 6.4% (+3.70)#8,065 |
| 42. | 08620 | 9.9% | 5.2% (+4.67)#42 | 6.4% (+3.56)#8,246 |
| 43. | 08554 | 9.9% | 5.2% (+4.66)#43 | 6.4% (+3.55)#8,261 |
| 44. | 07075 | 9.8% | 5.2% (+4.61)#44 | 6.4% (+3.49)#8,319 |
| 45. | 08535 | 9.8% | 5.2% (+4.61)#45 | 6.4% (+3.49)#8,324 |
| 46. | 08221 | 9.8% | 5.2% (+4.56)#46 | 6.4% (+3.44)#8,399 |
| 47. | 08502 | 9.5% | 5.2% (+4.28)#47 | 6.4% (+3.16)#8,754 |
| 48. | 07863 | 9.5% | 5.2% (+4.25)#48 | 6.4% (+3.14)#8,780 |
| 49. | 08104 | 9.3% | 5.2% (+4.05)#49 | 6.4% (+2.94)#9,080 |
| 50. | 08033 | 9.3% | 5.2% (+4.02)#50 | 6.4% (+2.90)#9,127 |
| 51. | 08084 | 9.2% | 5.2% (+4.01)#51 | 6.4% (+2.89)#9,141 |
| 52. | 08826 | 9.2% | 5.2% (+4.00)#52 | 6.4% (+2.89)#9,143 |
| 53. | 08010 | 9.2% | 5.2% (+3.98)#53 | 6.4% (+2.86)#9,182 |
| 54. | 08809 | 9.2% | 5.2% (+3.92)#54 | 6.4% (+2.81)#9,265 |
| 55. | 08057 | 9.0% | 5.2% (+3.75)#55 | 6.4% (+2.64)#9,554 |
| 56. | 07416 | 8.9% | 5.2% (+3.71)#56 | 6.4% (+2.59)#9,627 |
| 57. | 08534 | 8.9% | 5.2% (+3.66)#57 | 6.4% (+2.54)#9,720 |
| 58. | 08402 | 8.9% | 5.2% (+3.65)#58 | 6.4% (+2.54)#9,725 |
| 59. | 08069 | 8.9% | 5.2% (+3.65)#59 | 6.4% (+2.53)#9,736 |
| 60. | 07021 | 8.9% | 5.2% (+3.63)#60 | 6.4% (+2.51)#9,758 |
| 61. | 07632 | 8.8% | 5.2% (+3.60)#61 | 6.4% (+2.48)#9,794 |
| 62. | 07720 | 8.8% | 5.2% (+3.53)#62 | 6.4% (+2.41)#9,905 |
| 63. | 07757 | 8.8% | 5.2% (+3.52)#63 | 6.4% (+2.40)#9,925 |
| 64. | 07440 | 8.7% | 5.2% (+3.50)#64 | 6.4% (+2.38)#9,954 |
| 65. | 07727 | 8.7% | 5.2% (+3.46)#65 | 6.4% (+2.34)#10,028 |
| 66. | 08049 | 8.6% | 5.2% (+3.34)#66 | 6.4% (+2.22)#10,199 |
| 67. | 08558 | 8.6% | 5.2% (+3.33)#67 | 6.4% (+2.21)#10,216 |
| 68. | 08533 | 8.6% | 5.2% (+3.32)#68 | 6.4% (+2.20)#10,228 |
| 69. | 08835 | 8.5% | 5.2% (+3.26)#69 | 6.4% (+2.14)#10,317 |
| 70. | 07931 | 8.5% | 5.2% (+3.24)#70 | 6.4% (+2.12)#10,368 |
| 71. | 07501 | 8.4% | 5.2% (+3.18)#71 | 6.4% (+2.06)#10,458 |
| 72. | 07031 | 8.4% | 5.2% (+3.12)#72 | 6.4% (+2.00)#10,559 |
| 73. | 07419 | 8.3% | 5.2% (+3.11)#73 | 6.4% (+1.99)#10,574 |
| 74. | 08105 | 8.3% | 5.2% (+3.07)#74 | 6.4% (+1.95)#10,663 |
| 75. | 07027 | 8.3% | 5.2% (+3.03)#75 | 6.4% (+1.91)#10,722 |
| 76. | 07750 | 8.3% | 5.2% (+3.02)#76 | 6.4% (+1.91)#10,733 |
| 77. | 07504 | 8.2% | 5.2% (+3.01)#77 | 6.4% (+1.89)#10,769 |
| 78. | 07930 | 8.2% | 5.2% (+2.99)#78 | 6.4% (+1.88)#10,790 |
| 79. | 07803 | 8.2% | 5.2% (+2.98)#79 | 6.4% (+1.86)#10,809 |
| 80. | 07830 | 8.2% | 5.2% (+2.96)#80 | 6.4% (+1.85)#10,836 |
| 81. | 08244 | 8.2% | 5.2% (+2.93)#81 | 6.4% (+1.81)#10,901 |
| 82. | 08323 | 8.2% | 5.2% (+2.93)#82 | 6.4% (+1.81)#10,908 |
| 83. | 07420 | 8.2% | 5.2% (+2.92)#83 | 6.4% (+1.81)#10,912 |
| 84. | 07979 | 8.2% | 5.2% (+2.92)#84 | 6.4% (+1.80)#10,918 |
| 85. | 08212 | 8.1% | 5.2% (+2.89)#85 | 6.4% (+1.78)#10,960 |
| 86. | 08518 | 8.1% | 5.2% (+2.87)#86 | 6.4% (+1.75)#11,009 |
| 87. | 07009 | 8.0% | 5.2% (+2.78)#87 | 6.4% (+1.66)#11,157 |
| 88. | 07403 | 8.0% | 5.2% (+2.74)#88 | 6.4% (+1.62)#11,230 |
| 89. | 08720 | 8.0% | 5.2% (+2.73)#89 | 6.4% (+1.61)#11,249 |
| 90. | 07932 | 7.9% | 5.2% (+2.71)#90 | 6.4% (+1.59)#11,292 |
| 91. | 08867 | 7.9% | 5.2% (+2.66)#91 | 6.4% (+1.55)#11,381 |
| 92. | 07711 | 7.9% | 5.2% (+2.65)#92 | 6.4% (+1.54)#11,411 |
| 93. | 07718 | 7.8% | 5.2% (+2.53)#93 | 6.4% (+1.41)#11,634 |
| 94. | 08062 | 7.7% | 5.2% (+2.44)#94 | 6.4% (+1.32)#11,840 |
| 95. | 08086 | 7.6% | 5.2% (+2.36)#95 | 6.4% (+1.25)#11,984 |
| 96. | 08318 | 7.6% | 5.2% (+2.34)#96 | 6.4% (+1.22)#12,023 |
| 97. | 08088 | 7.6% | 5.2% (+2.33)#97 | 6.4% (+1.21)#12,065 |
| 98. | 07656 | 7.6% | 5.2% (+2.31)#98 | 6.4% (+1.20)#12,084 |
| 99. | 08078 | 7.5% | 5.2% (+2.26)#99 | 6.4% (+1.15)#12,165 |
| 100. | 08330 | 7.5% | 5.2% (+2.26)#100 | 6.4% (+1.14)#12,188 |
Common Questions
What are the Top 10 Zip Codes with the Highest Percentage of Population with a Degree in Bio, Nature & Agricultural in New Jersey?
Top 10 Zip Codes with the Highest Percentage of Population with a Degree in Bio, Nature & Agricultural in New Jersey are:
What zip code has the Highest Percentage of Population with a Degree in Bio, Nature & Agricultural in New Jersey?
08320 has the Highest Percentage of Population with a Degree in Bio, Nature & Agricultural in New Jersey with 100.0%.
What is the Percentage of Population with a Degree in Bio, Nature & Agricultural in the State of New Jersey?
Percentage of Population with a Degree in Bio, Nature & Agricultural in New Jersey is 5.2%.
What is the Percentage of Population with a Degree in Bio, Nature & Agricultural in the United States?
Percentage of Population with a Degree in Bio, Nature & Agricultural in the United States is 6.4%.