Cities with the Highest Percentage of Guyanese Population in Maryland
RELATED REPORTS & OPTIONS
Guyanese
Maryland
Compare Cities
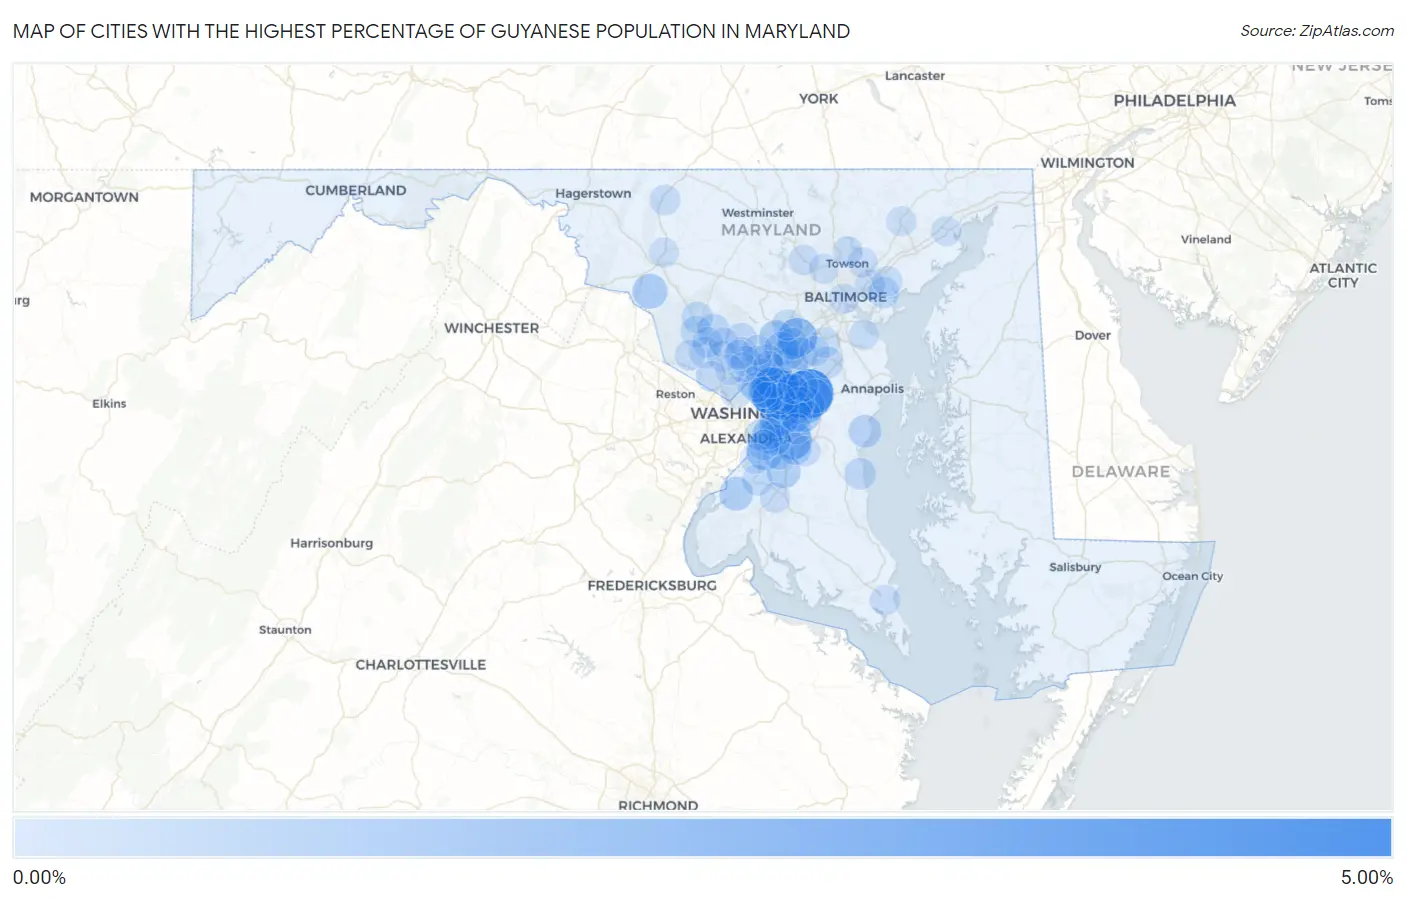
Map of Cities with the Highest Percentage of Guyanese Population in Maryland
0.00%
5.00%
Cities with the Highest Percentage of Guyanese Population in Maryland
| City | Guyanese | vs State | vs National | |
| 1. | Fairwood | 4.13% | 0.14%(+3.99)#1 | 0.078%(+4.05)#16 |
| 2. | Riverdale Park | 4.04% | 0.14%(+3.90)#2 | 0.078%(+3.96)#17 |
| 3. | Savage | 1.85% | 0.14%(+1.71)#3 | 0.078%(+1.77)#58 |
| 4. | Melwood | 1.83% | 0.14%(+1.70)#4 | 0.078%(+1.75)#59 |
| 5. | Capitol Heights | 1.76% | 0.14%(+1.62)#5 | 0.078%(+1.68)#63 |
| 6. | Ten Mile Creek | 1.64% | 0.14%(+1.51)#6 | 0.078%(+1.57)#74 |
| 7. | New Carrollton | 1.48% | 0.14%(+1.34)#7 | 0.078%(+1.40)#80 |
| 8. | East Riverdale | 1.44% | 0.14%(+1.31)#8 | 0.078%(+1.37)#83 |
| 9. | Woodmore | 1.42% | 0.14%(+1.28)#9 | 0.078%(+1.34)#85 |
| 10. | Friendly | 1.11% | 0.14%(+0.972)#10 | 0.078%(+1.03)#108 |
| 11. | Glenarden | 1.03% | 0.14%(+0.889)#11 | 0.078%(+0.948)#120 |
| 12. | Adamstown | 1.00% | 0.14%(+0.866)#12 | 0.078%(+0.924)#123 |
| 13. | Lanham | 0.95% | 0.14%(+0.815)#13 | 0.078%(+0.874)#129 |
| 14. | Fulton | 0.92% | 0.14%(+0.783)#14 | 0.078%(+0.842)#132 |
| 15. | Woodlawn Cdp Prince George S County | 0.89% | 0.14%(+0.755)#15 | 0.078%(+0.813)#136 |
| 16. | Bowie | 0.88% | 0.14%(+0.747)#16 | 0.078%(+0.806)#139 |
| 17. | Brandywine | 0.78% | 0.14%(+0.646)#17 | 0.078%(+0.705)#157 |
| 18. | Bryans Road | 0.78% | 0.14%(+0.643)#18 | 0.078%(+0.702)#160 |
| 19. | Kettering | 0.76% | 0.14%(+0.627)#19 | 0.078%(+0.686)#163 |
| 20. | South Laurel | 0.71% | 0.14%(+0.574)#20 | 0.078%(+0.633)#174 |
| 21. | West Laurel | 0.69% | 0.14%(+0.556)#21 | 0.078%(+0.614)#179 |
| 22. | Walker Mill | 0.68% | 0.14%(+0.545)#22 | 0.078%(+0.604)#183 |
| 23. | Shady Side | 0.58% | 0.14%(+0.448)#23 | 0.078%(+0.507)#212 |
| 24. | Temple Hills | 0.54% | 0.14%(+0.405)#24 | 0.078%(+0.463)#232 |
| 25. | Lake Arbor | 0.54% | 0.14%(+0.400)#25 | 0.078%(+0.459)#234 |
| 26. | Peppermill Village | 0.51% | 0.14%(+0.378)#26 | 0.078%(+0.437)#241 |
| 27. | Maryland City | 0.50% | 0.14%(+0.359)#27 | 0.078%(+0.418)#250 |
| 28. | Landover | 0.50% | 0.14%(+0.358)#28 | 0.078%(+0.417)#251 |
| 29. | Rosaryville | 0.48% | 0.14%(+0.345)#29 | 0.078%(+0.404)#258 |
| 30. | Beltsville | 0.48% | 0.14%(+0.345)#30 | 0.078%(+0.404)#259 |
| 31. | Hillandale | 0.48% | 0.14%(+0.343)#31 | 0.078%(+0.402)#262 |
| 32. | Montgomery Village | 0.43% | 0.14%(+0.298)#32 | 0.078%(+0.356)#293 |
| 33. | Greenbelt | 0.43% | 0.14%(+0.297)#33 | 0.078%(+0.356)#294 |
| 34. | Laurel | 0.40% | 0.14%(+0.262)#34 | 0.078%(+0.321)#308 |
| 35. | North Laurel | 0.39% | 0.14%(+0.256)#35 | 0.078%(+0.315)#313 |
| 36. | North Brentwood | 0.39% | 0.14%(+0.255)#36 | 0.078%(+0.314)#316 |
| 37. | Clinton | 0.39% | 0.14%(+0.253)#37 | 0.078%(+0.312)#317 |
| 38. | Adelphi | 0.37% | 0.14%(+0.235)#38 | 0.078%(+0.294)#329 |
| 39. | Olney | 0.37% | 0.14%(+0.232)#39 | 0.078%(+0.291)#332 |
| 40. | Hyattsville | 0.36% | 0.14%(+0.227)#40 | 0.078%(+0.286)#334 |
| 41. | Chesapeake Beach | 0.36% | 0.14%(+0.225)#41 | 0.078%(+0.284)#336 |
| 42. | Odenton | 0.34% | 0.14%(+0.207)#42 | 0.078%(+0.266)#348 |
| 43. | Fairland | 0.33% | 0.14%(+0.194)#43 | 0.078%(+0.253)#360 |
| 44. | Essex | 0.32% | 0.14%(+0.186)#44 | 0.078%(+0.245)#365 |
| 45. | Mitchellville | 0.32% | 0.14%(+0.185)#45 | 0.078%(+0.244)#367 |
| 46. | Suitland | 0.32% | 0.14%(+0.184)#46 | 0.078%(+0.243)#368 |
| 47. | Clarksburg | 0.31% | 0.14%(+0.174)#47 | 0.078%(+0.232)#373 |
| 48. | Camp Springs | 0.30% | 0.14%(+0.164)#48 | 0.078%(+0.223)#384 |
| 49. | Largo | 0.30% | 0.14%(+0.161)#49 | 0.078%(+0.220)#386 |
| 50. | Burnt Mills | 0.29% | 0.14%(+0.157)#50 | 0.078%(+0.216)#389 |
| 51. | Marlow Heights | 0.29% | 0.14%(+0.151)#51 | 0.078%(+0.210)#397 |
| 52. | North Potomac | 0.28% | 0.14%(+0.142)#52 | 0.078%(+0.201)#410 |
| 53. | Germantown | 0.27% | 0.14%(+0.137)#53 | 0.078%(+0.196)#417 |
| 54. | Silver Spring | 0.27% | 0.14%(+0.129)#54 | 0.078%(+0.188)#426 |
| 55. | Columbia | 0.27% | 0.14%(+0.128)#55 | 0.078%(+0.187)#428 |
| 56. | Brentwood | 0.26% | 0.14%(+0.127)#56 | 0.078%(+0.186)#430 |
| 57. | Friendship Heights Village | 0.25% | 0.14%(+0.118)#57 | 0.078%(+0.177)#447 |
| 58. | Glenn Dale | 0.25% | 0.14%(+0.112)#58 | 0.078%(+0.171)#458 |
| 59. | Glassmanor | 0.23% | 0.14%(+0.094)#59 | 0.078%(+0.152)#475 |
| 60. | College Park | 0.23% | 0.14%(+0.093)#60 | 0.078%(+0.151)#476 |
| 61. | Accokeek | 0.22% | 0.14%(+0.083)#61 | 0.078%(+0.142)#490 |
| 62. | Flower Hill | 0.20% | 0.14%(+0.061)#62 | 0.078%(+0.120)#513 |
| 63. | Landover Hills | 0.19% | 0.14%(+0.052)#63 | 0.078%(+0.111)#521 |
| 64. | Oxon Hill | 0.18% | 0.14%(+0.041)#64 | 0.078%(+0.100)#538 |
| 65. | Rockville | 0.17% | 0.14%(+0.033)#65 | 0.078%(+0.092)#552 |
| 66. | Leisure World | 0.17% | 0.14%(+0.030)#66 | 0.078%(+0.089)#557 |
| 67. | Chillum | 0.16% | 0.14%(+0.027)#67 | 0.078%(+0.086)#561 |
| 68. | Glenmont | 0.16% | 0.14%(+0.025)#68 | 0.078%(+0.084)#566 |
| 69. | Calverton | 0.16% | 0.14%(+0.021)#69 | 0.078%(+0.080)#576 |
| 70. | Severn | 0.16% | 0.14%(+0.021)#70 | 0.078%(+0.080)#581 |
| 71. | Gaithersburg | 0.16% | 0.14%(+0.019)#71 | 0.078%(+0.078)#582 |
| 72. | Thurmont | 0.14% | 0.14%(+0.006)#72 | 0.078%(+0.064)#610 |
| 73. | Colesville | 0.14% | 0.14%(+0.002)#73 | 0.078%(+0.061)#620 |
| 74. | Westphalia | 0.12% | 0.14%(-0.013)#74 | 0.078%(+0.046)#646 |
| 75. | Woodlawn Cdp Baltimore County | 0.12% | 0.14%(-0.014)#75 | 0.078%(+0.045)#648 |
| 76. | Owings Mills | 0.12% | 0.14%(-0.014)#76 | 0.078%(+0.045)#649 |
| 77. | Darnestown | 0.12% | 0.14%(-0.017)#77 | 0.078%(+0.042)#658 |
| 78. | Baltimore | 0.12% | 0.14%(-0.019)#78 | 0.078%(+0.040)#668 |
| 79. | Seabrook | 0.11% | 0.14%(-0.023)#79 | 0.078%(+0.036)#684 |
| 80. | Waldorf | 0.11% | 0.14%(-0.028)#80 | 0.078%(+0.030)#694 |
| 81. | Potomac | 0.099% | 0.14%(-0.038)#81 | 0.078%(+0.021)#727 |
| 82. | Marlton | 0.089% | 0.14%(-0.048)#82 | 0.078%(+0.010)#758 |
| 83. | Rosedale | 0.085% | 0.14%(-0.052)#83 | 0.078%(+0.007)#773 |
| 84. | Riviera Beach | 0.083% | 0.14%(-0.054)#84 | 0.078%(+0.004)#785 |
| 85. | Lexington Park | 0.081% | 0.14%(-0.056)#85 | 0.078%(+0.003)#789 |
| 86. | Takoma Park | 0.080% | 0.14%(-0.057)#86 | 0.078%(+0.002)#797 |
| 87. | Carney | 0.075% | 0.14%(-0.062)#87 | 0.078%(-0.003)#813 |
| 88. | Timonium | 0.074% | 0.14%(-0.063)#88 | 0.078%(-0.004)#817 |
| 89. | Middle River | 0.074% | 0.14%(-0.063)#89 | 0.078%(-0.004)#819 |
| 90. | Cloverly | 0.073% | 0.14%(-0.064)#90 | 0.078%(-0.005)#824 |
| 91. | Redland | 0.071% | 0.14%(-0.066)#91 | 0.078%(-0.007)#838 |
| 92. | Fort Washington | 0.062% | 0.14%(-0.075)#92 | 0.078%(-0.016)#872 |
| 93. | Fort Meade | 0.060% | 0.14%(-0.077)#93 | 0.078%(-0.018)#886 |
| 94. | Aberdeen | 0.055% | 0.14%(-0.082)#94 | 0.078%(-0.023)#903 |
| 95. | Pikesville | 0.053% | 0.14%(-0.084)#95 | 0.078%(-0.025)#916 |
| 96. | Frederick | 0.050% | 0.14%(-0.087)#96 | 0.078%(-0.028)#934 |
| 97. | Wheaton | 0.044% | 0.14%(-0.093)#97 | 0.078%(-0.034)#959 |
| 98. | Bel Air North | 0.042% | 0.14%(-0.095)#98 | 0.078%(-0.037)#969 |
| 99. | North Bethesda | 0.038% | 0.14%(-0.099)#99 | 0.078%(-0.040)#990 |
| 100. | Aspen Hill | 0.029% | 0.14%(-0.108)#100 | 0.078%(-0.049)#1,035 |
Common Questions
What are the Top 10 Cities with the Highest Percentage of Guyanese Population in Maryland?
Top 10 Cities with the Highest Percentage of Guyanese Population in Maryland are:
#1
4.13%
#2
4.04%
#3
1.85%
#4
1.83%
#5
1.76%
#6
1.48%
#7
1.44%
#8
1.42%
#9
1.11%
#10
1.03%
What city has the Highest Percentage of Guyanese Population in Maryland?
Fairwood has the Highest Percentage of Guyanese Population in Maryland with 4.13%.
What is the Percentage of Guyanese Population in the State of Maryland?
Percentage of Guyanese Population in Maryland is 0.14%.
What is the Percentage of Guyanese Population in the United States?
Percentage of Guyanese Population in the United States is 0.078%.