Cities with the Highest Percentage of Guyanese Population in New York
RELATED REPORTS & OPTIONS
Guyanese
New York
Compare Cities
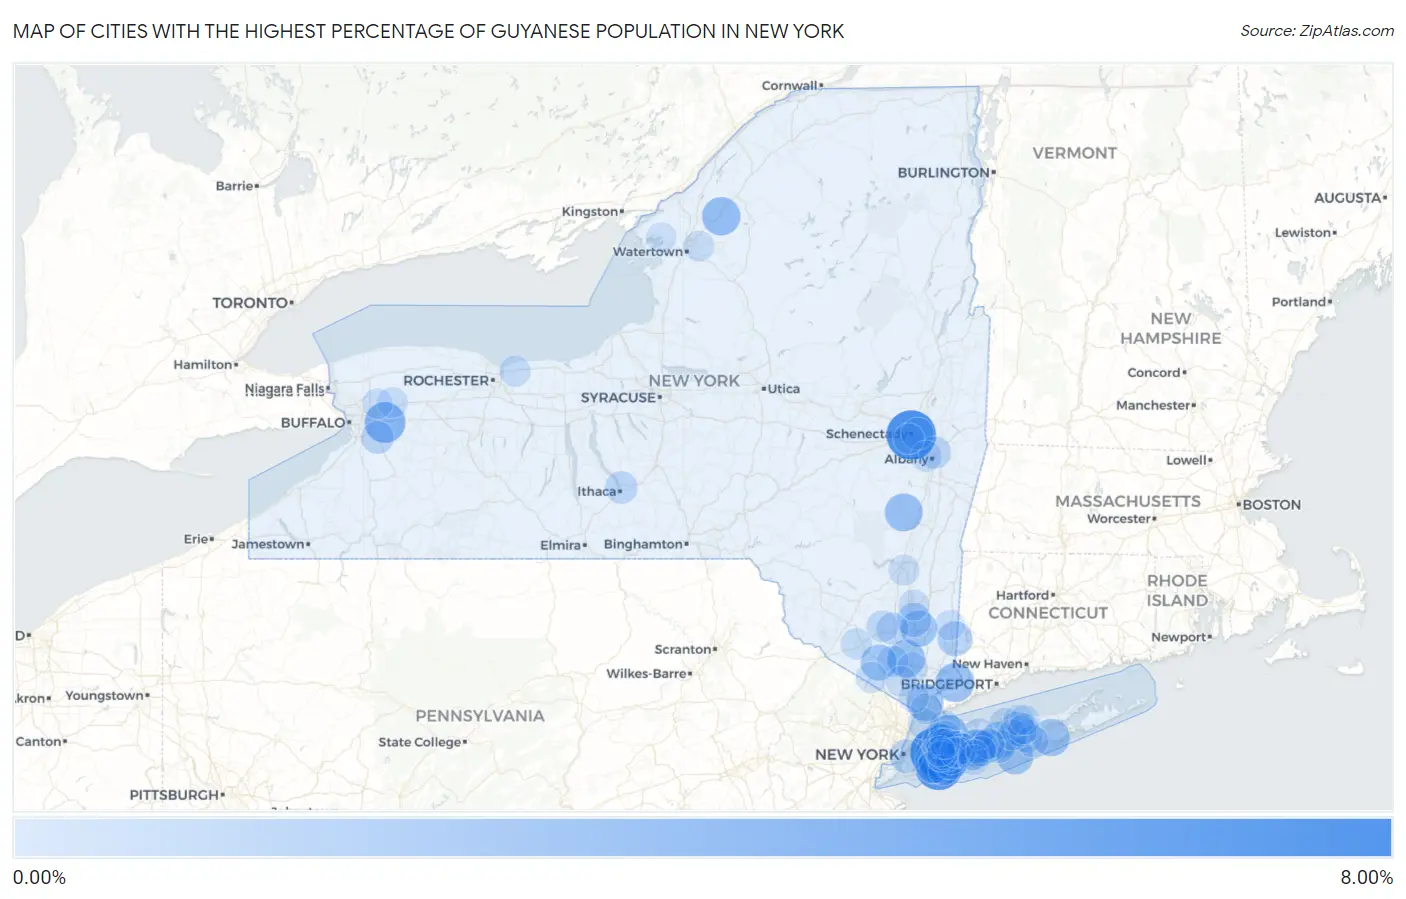
Map of Cities with the Highest Percentage of Guyanese Population in New York
0.00%
8.00%
Cities with the Highest Percentage of Guyanese Population in New York
| City | Guyanese | vs State | vs National | |
| 1. | Schenectady | 6.54% | 0.76%(+5.79)#1 | 0.078%(+6.47)#2 |
| 2. | Bellerose Terrace | 6.51% | 0.76%(+5.75)#2 | 0.078%(+6.43)#3 |
| 3. | Lakeview | 6.33% | 0.76%(+5.57)#3 | 0.078%(+6.25)#4 |
| 4. | Hewlett Bay Park | 5.95% | 0.76%(+5.19)#4 | 0.078%(+5.87)#5 |
| 5. | Elmont | 5.02% | 0.76%(+4.27)#5 | 0.078%(+4.94)#12 |
| 6. | South Valley Stream | 4.27% | 0.76%(+3.52)#6 | 0.078%(+4.20)#14 |
| 7. | Searingtown | 3.74% | 0.76%(+2.99)#7 | 0.078%(+3.67)#18 |
| 8. | Town Line | 3.69% | 0.76%(+2.93)#8 | 0.078%(+3.61)#19 |
| 9. | North Valley Stream | 3.27% | 0.76%(+2.51)#9 | 0.078%(+3.19)#23 |
| 10. | Sparrow Bush | 3.22% | 0.76%(+2.47)#10 | 0.078%(+3.15)#24 |
| 11. | Scotts Corners | 3.06% | 0.76%(+2.31)#11 | 0.078%(+2.99)#26 |
| 12. | Antwerp | 2.96% | 0.76%(+2.20)#12 | 0.078%(+2.88)#27 |
| 13. | Cairo | 2.81% | 0.76%(+2.05)#13 | 0.078%(+2.73)#29 |
| 14. | Glen Head | 2.79% | 0.76%(+2.03)#14 | 0.078%(+2.71)#30 |
| 15. | Fort Montgomery | 2.73% | 0.76%(+1.97)#15 | 0.078%(+2.65)#31 |
| 16. | Valley Stream | 2.72% | 0.76%(+1.96)#16 | 0.078%(+2.64)#33 |
| 17. | Stewart Manor | 2.63% | 0.76%(+1.87)#17 | 0.078%(+2.55)#35 |
| 18. | Remsenburg Speonk | 2.60% | 0.76%(+1.84)#18 | 0.078%(+2.52)#37 |
| 19. | Elmsford | 2.50% | 0.76%(+1.75)#19 | 0.078%(+2.43)#38 |
| 20. | Wyandanch | 2.50% | 0.76%(+1.74)#20 | 0.078%(+2.42)#39 |
| 21. | Islandia | 2.44% | 0.76%(+1.68)#21 | 0.078%(+2.36)#41 |
| 22. | Fire Island | 2.35% | 0.76%(+1.59)#22 | 0.078%(+2.27)#43 |
| 23. | Merritt Park | 2.34% | 0.76%(+1.58)#23 | 0.078%(+2.26)#44 |
| 24. | Salisbury | 2.25% | 0.76%(+1.49)#24 | 0.078%(+2.17)#47 |
| 25. | Walton Park | 2.25% | 0.76%(+1.49)#25 | 0.078%(+2.17)#48 |
| 26. | Woodmere | 2.01% | 0.76%(+1.25)#26 | 0.078%(+1.93)#54 |
| 27. | Fairview Cdp Dutchess County | 1.95% | 0.76%(+1.20)#27 | 0.078%(+1.88)#55 |
| 28. | Putnam Lake | 1.88% | 0.76%(+1.12)#28 | 0.078%(+1.80)#57 |
| 29. | Wheatley Heights | 1.65% | 0.76%(+0.891)#29 | 0.078%(+1.57)#72 |
| 30. | Wappingers Falls | 1.65% | 0.76%(+0.888)#30 | 0.078%(+1.57)#73 |
| 31. | Coram | 1.60% | 0.76%(+0.846)#31 | 0.078%(+1.52)#76 |
| 32. | Marist College | 1.56% | 0.76%(+0.799)#32 | 0.078%(+1.48)#78 |
| 33. | New York | 1.45% | 0.76%(+0.688)#33 | 0.078%(+1.37)#81 |
| 34. | North Great River | 1.41% | 0.76%(+0.656)#34 | 0.078%(+1.33)#88 |
| 35. | Baldwin | 1.32% | 0.76%(+0.560)#35 | 0.078%(+1.24)#95 |
| 36. | North Bay Shore | 1.29% | 0.76%(+0.531)#36 | 0.078%(+1.21)#97 |
| 37. | Uniondale | 1.18% | 0.76%(+0.421)#37 | 0.078%(+1.10)#101 |
| 38. | Yaphank | 1.17% | 0.76%(+0.415)#38 | 0.078%(+1.09)#102 |
| 39. | Billington Heights | 1.17% | 0.76%(+0.413)#39 | 0.078%(+1.09)#103 |
| 40. | Manhasset Hills | 1.15% | 0.76%(+0.396)#40 | 0.078%(+1.07)#105 |
| 41. | West Hempstead | 1.14% | 0.76%(+0.385)#41 | 0.078%(+1.06)#107 |
| 42. | Cayuga Heights | 1.09% | 0.76%(+0.331)#42 | 0.078%(+1.01)#109 |
| 43. | Hempstead | 1.06% | 0.76%(+0.305)#43 | 0.078%(+0.984)#111 |
| 44. | Garden City Park | 1.05% | 0.76%(+0.298)#44 | 0.078%(+0.977)#112 |
| 45. | Menands | 1.04% | 0.76%(+0.285)#45 | 0.078%(+0.964)#115 |
| 46. | Deer Park | 1.03% | 0.76%(+0.276)#46 | 0.078%(+0.955)#117 |
| 47. | Niskayuna | 1.00% | 0.76%(+0.246)#47 | 0.078%(+0.925)#121 |
| 48. | Orange Lake | 0.99% | 0.76%(+0.237)#48 | 0.078%(+0.916)#124 |
| 49. | Bard College | 0.99% | 0.76%(+0.234)#49 | 0.078%(+0.913)#125 |
| 50. | Stony Brook University | 0.94% | 0.76%(+0.179)#50 | 0.078%(+0.859)#131 |
| 51. | Inwood | 0.91% | 0.76%(+0.148)#51 | 0.078%(+0.827)#133 |
| 52. | Plandome Manor | 0.90% | 0.76%(+0.145)#52 | 0.078%(+0.824)#134 |
| 53. | Walden | 0.89% | 0.76%(+0.132)#53 | 0.078%(+0.811)#138 |
| 54. | Shirley | 0.88% | 0.76%(+0.126)#54 | 0.078%(+0.805)#140 |
| 55. | Glen Cove | 0.85% | 0.76%(+0.089)#55 | 0.078%(+0.768)#146 |
| 56. | Mount Vernon | 0.80% | 0.76%(+0.046)#56 | 0.078%(+0.725)#151 |
| 57. | St. John Fisher College | 0.78% | 0.76%(+0.027)#57 | 0.078%(+0.706)#155 |
| 58. | Woodbury | 0.78% | 0.76%(+0.026)#58 | 0.078%(+0.705)#158 |
| 59. | Westbury | 0.75% | 0.76%(-0.003)#59 | 0.078%(+0.676)#164 |
| 60. | Middletown | 0.75% | 0.76%(-0.005)#60 | 0.078%(+0.674)#165 |
| 61. | North Amityville | 0.75% | 0.76%(-0.005)#61 | 0.078%(+0.674)#166 |
| 62. | Freeport | 0.74% | 0.76%(-0.022)#62 | 0.078%(+0.657)#167 |
| 63. | Greenwood Lake | 0.73% | 0.76%(-0.030)#63 | 0.078%(+0.649)#170 |
| 64. | Webster | 0.72% | 0.76%(-0.041)#64 | 0.078%(+0.638)#172 |
| 65. | Glenwood Landing | 0.70% | 0.76%(-0.053)#65 | 0.078%(+0.626)#176 |
| 66. | Roosevelt | 0.69% | 0.76%(-0.066)#66 | 0.078%(+0.613)#180 |
| 67. | Albany | 0.69% | 0.76%(-0.069)#67 | 0.078%(+0.610)#181 |
| 68. | Elwood | 0.67% | 0.76%(-0.083)#68 | 0.078%(+0.596)#185 |
| 69. | Gordon Heights | 0.67% | 0.76%(-0.085)#69 | 0.078%(+0.594)#187 |
| 70. | Hartsdale | 0.65% | 0.76%(-0.108)#70 | 0.078%(+0.571)#191 |
| 71. | Hicksville | 0.65% | 0.76%(-0.111)#71 | 0.078%(+0.568)#192 |
| 72. | Poughkeepsie | 0.64% | 0.76%(-0.120)#72 | 0.078%(+0.559)#196 |
| 73. | Bethpage | 0.62% | 0.76%(-0.138)#73 | 0.078%(+0.541)#203 |
| 74. | Akron | 0.62% | 0.76%(-0.139)#74 | 0.078%(+0.540)#204 |
| 75. | Black River | 0.60% | 0.76%(-0.155)#75 | 0.078%(+0.524)#210 |
| 76. | Farmingville | 0.59% | 0.76%(-0.171)#76 | 0.078%(+0.508)#211 |
| 77. | Miller Place | 0.58% | 0.76%(-0.175)#77 | 0.078%(+0.504)#215 |
| 78. | Brentwood | 0.58% | 0.76%(-0.177)#78 | 0.078%(+0.502)#217 |
| 79. | Kingston | 0.58% | 0.76%(-0.178)#79 | 0.078%(+0.501)#218 |
| 80. | Levittown | 0.58% | 0.76%(-0.180)#80 | 0.078%(+0.499)#219 |
| 81. | Peekskill | 0.57% | 0.76%(-0.186)#81 | 0.078%(+0.493)#221 |
| 82. | Siena College | 0.57% | 0.76%(-0.190)#82 | 0.078%(+0.489)#226 |
| 83. | Middle Island | 0.56% | 0.76%(-0.198)#83 | 0.078%(+0.481)#229 |
| 84. | Mount Ivy | 0.54% | 0.76%(-0.214)#84 | 0.078%(+0.465)#231 |
| 85. | Island Park | 0.53% | 0.76%(-0.232)#85 | 0.078%(+0.447)#236 |
| 86. | Clarence Center | 0.52% | 0.76%(-0.236)#86 | 0.078%(+0.443)#239 |
| 87. | North Hills | 0.52% | 0.76%(-0.241)#87 | 0.078%(+0.438)#240 |
| 88. | North Lindenhurst | 0.51% | 0.76%(-0.246)#88 | 0.078%(+0.433)#242 |
| 89. | Nyack | 0.51% | 0.76%(-0.247)#89 | 0.078%(+0.432)#243 |
| 90. | Rotterdam | 0.50% | 0.76%(-0.254)#90 | 0.078%(+0.425)#247 |
| 91. | Franklin Square | 0.50% | 0.76%(-0.257)#91 | 0.078%(+0.422)#248 |
| 92. | Pawling | 0.49% | 0.76%(-0.262)#92 | 0.078%(+0.417)#252 |
| 93. | Garden City South | 0.46% | 0.76%(-0.295)#93 | 0.078%(+0.384)#272 |
| 94. | East Meadow | 0.45% | 0.76%(-0.304)#94 | 0.078%(+0.375)#277 |
| 95. | Rocky Point | 0.44% | 0.76%(-0.320)#95 | 0.078%(+0.359)#289 |
| 96. | Chaumont | 0.44% | 0.76%(-0.320)#96 | 0.078%(+0.359)#290 |
| 97. | Roslyn Heights | 0.43% | 0.76%(-0.323)#97 | 0.078%(+0.356)#295 |
| 98. | Copiague | 0.41% | 0.76%(-0.343)#98 | 0.078%(+0.336)#302 |
| 99. | New Hyde Park | 0.41% | 0.76%(-0.347)#99 | 0.078%(+0.332)#303 |
| 100. | North Babylon | 0.40% | 0.76%(-0.360)#100 | 0.078%(+0.319)#310 |
Common Questions
What are the Top 10 Cities with the Highest Percentage of Guyanese Population in New York?
Top 10 Cities with the Highest Percentage of Guyanese Population in New York are:
#1
6.54%
#2
6.51%
#3
6.33%
#4
5.95%
#5
5.02%
#6
4.27%
#7
3.74%
#8
3.69%
#9
3.27%
#10
3.06%
What city has the Highest Percentage of Guyanese Population in New York?
Schenectady has the Highest Percentage of Guyanese Population in New York with 6.54%.
What is the Percentage of Guyanese Population in the State of New York?
Percentage of Guyanese Population in New York is 0.76%.
What is the Percentage of Guyanese Population in the United States?
Percentage of Guyanese Population in the United States is 0.078%.