Cities with the Highest Percentage of Guyanese Population in Massachusetts

RELATED REPORTS & OPTIONS

Guyanese
Population
Families and Households
Female Fertility
Female Fertility (Unmarried)
Race (Community Size)
Race (Percentage)
Ancestry (Community Size)
AfghanAfricanAlaska NativeAlaskan AthabascanAlbanianAleutAlsatianAmericanApacheArabArapahoArgentineanArmenianAssyrian / Chaldean / SyriacAustralianAustrianBahamianBangladeshiBarbadianBasqueBelgianBelizeanBermudanBhutaneseBlackfeetBolivianBrazilianBritishBritish West IndianBulgarianBurmeseCajunCambodianCanadianCape VerdeanCarpatho RusynCelticCentral AmericanCentral American IndianCherokeeCheyenneChickasawChileanChineseChippewaChoctawColombianColvilleComancheCosta RicanCreeCreekCroatianCrowCubanCypriotCzechCzechoslovakianDanishDelawareDominicanDutchDutch West IndianEastern EuropeanEcuadorianEgyptianEnglishEstonianEthiopianEuropeanFijianFilipinoFinnishFrenchFrench American IndianFrench CanadianGermanGerman RussianGhanaianGreekGuamanian / ChamorroGuatemalanGuyaneseHaitianHmongHonduranHopiHoumaHungarianIcelanderIndian (Asian)IndonesianInupiatIranianIraqiIrishIroquoisIsraeliItalianJamaicanJapaneseJordanianKenyanKiowaKoreanLaotianLatvianLebaneseLiberianLithuanianLumbeeLuxembourgerMacedonianMalaysianMalteseMarshalleseMenomineeMexicanMexican American IndianMongolianMoroccanNative HawaiianNavajoNepaleseNew ZealanderNicaraguanNigerianNorthern EuropeanNorwegianOkinawanOsageOttawaPaiutePakistaniPalestinianPanamanianParaguayanPennsylvania GermanPeruvianPimaPolishPortuguesePotawatomiPuebloPuerto RicanPuget Sound SalishRomanianRussianSalvadoranSamoanScandinavianScotch-IrishScottishSeminoleSenegaleseSerbianShoshoneSierra LeoneanSiouxSlavicSlovakSloveneSomaliSouth AfricanSouth AmericanSouth American IndianSoviet UnionSpaniardSpanishSpanish AmericanSpanish American IndianSri LankanSubsaharan AfricanSudaneseSwedishSwissSyrianTaiwaneseThaiTlingit-HaidaTohono O'OdhamTonganTrinidadian and TobagonianTsimshianTurkishU.S. Virgin IslanderUgandanUkrainianUruguayanUteVenezuelanVietnameseWelshWest IndianYakamaYaquiYugoslavianYumanYup'ikZimbabwean
Ancestry (Percentage)
AfghanAfricanAlaska NativeAlaskan AthabascanAlbanianAleutAlsatianAmericanApacheArabArapahoArgentineanArmenianAssyrian / Chaldean / SyriacAustralianAustrianBahamianBangladeshiBarbadianBasqueBelgianBelizeanBermudanBhutaneseBlackfeetBolivianBrazilianBritishBritish West IndianBulgarianBurmeseCajunCambodianCanadianCape VerdeanCarpatho RusynCelticCentral AmericanCentral American IndianCherokeeCheyenneChickasawChileanChineseChippewaChoctawColombianColvilleComancheCosta RicanCreeCreekCroatianCrowCubanCypriotCzechCzechoslovakianDanishDelawareDominicanDutchDutch West IndianEastern EuropeanEcuadorianEgyptianEnglishEstonianEthiopianEuropeanFijianFilipinoFinnishFrenchFrench American IndianFrench CanadianGermanGerman RussianGhanaianGreekGuamanian / ChamorroGuatemalanGuyaneseHaitianHmongHonduranHopiHoumaHungarianIcelanderIndian (Asian)IndonesianInupiatIranianIraqiIrishIroquoisIsraeliItalianJamaicanJapaneseJordanianKenyanKiowaKoreanLaotianLatvianLebaneseLiberianLithuanianLumbeeLuxembourgerMacedonianMalaysianMalteseMarshalleseMenomineeMexicanMexican American IndianMongolianMoroccanNative HawaiianNavajoNepaleseNew ZealanderNicaraguanNigerianNorthern EuropeanNorwegianOkinawanOsageOttawaPaiutePakistaniPalestinianPanamanianParaguayanPennsylvania GermanPeruvianPimaPolishPortuguesePotawatomiPuebloPuerto RicanPuget Sound SalishRomanianRussianSalvadoranSamoanScandinavianScotch-IrishScottishSeminoleSenegaleseSerbianShoshoneSierra LeoneanSiouxSlavicSlovakSloveneSomaliSouth AfricanSouth AmericanSouth American IndianSoviet UnionSpaniardSpanishSpanish AmericanSpanish American IndianSri LankanSubsaharan AfricanSudaneseSwedishSwissSyrianTaiwaneseThaiTlingit-HaidaTohono O'OdhamTonganTrinidadian and TobagonianTsimshianTurkishU.S. Virgin IslanderUgandanUkrainianUruguayanUteVenezuelanVietnameseWelshWest IndianYakamaYaquiYugoslavianYumanYup'ikZimbabwean
Immigrant Origin (Total)
AfghanistanAfricaAlbaniaArgentinaArmeniaAsiaAustraliaAustriaAzoresBahamasBangladeshBarbadosBelarusBelgiumBelizeBoliviaBosnia and HerzegovinaBrazilBulgariaBurma / MyanmarCabo VerdeCambodiaCameroonCanadaCaribbeanCentral AmericaChileChinaColombiaCongoCosta RicaCroatiaCubaCzechoslovakiaDenmarkDominicaDominican RepublicEastern AfricaEastern AsiaEastern EuropeEcuadorEgyptEl SalvadorEnglandEritreaEthiopiaEuropeFijiFranceGermanyGhanaGreeceGrenadaGuatemalaGuyanaHaitiHondurasHong KongHungaryIndiaIndonesiaIranIraqIrelandIsraelItalyJamaicaJapanJordanKazakhstanKenyaKoreaKuwaitLaosLatin AmericaLatviaLebanonLiberiaLithuaniaMalaysiaMexicoMicronesiaMiddle AfricaMoldovaMoroccoNepalNetherlandsNicaraguaNigeriaNorth MacedoniaNorthern AfricaNorthern EuropeNorwayOceaniaPakistanPanamaPeruPhilippinesPolandPortugalRomaniaRussiaSaudi ArabiaScotlandSenegalSerbiaSierra LeoneSingaporeSomaliaSouth AfricaSouth AmericaSouth Central AsiaSouth Eastern AsiaSouthern EuropeSpainSri LankaSt. Vincent and the GrenadinesSudanSwedenSwitzerlandSyriaTaiwanThailandTrinidad and TobagoTurkeyUgandaUkraineUruguayUzbekistanVenezuelaVietnamWest IndiesWestern AfricaWestern AsiaWestern EuropeYemenZaireZimbabwe
Immigrant Origin (Percentage)
AfghanistanAfricaAlbaniaArgentinaArmeniaAsiaAustraliaAustriaAzoresBahamasBangladeshBarbadosBelarusBelgiumBelizeBoliviaBosnia and HerzegovinaBrazilBulgariaBurma / MyanmarCabo VerdeCambodiaCameroonCanadaCaribbeanCentral AmericaChileChinaColombiaCongoCosta RicaCroatiaCubaCzechoslovakiaDenmarkDominicaDominican RepublicEastern AfricaEastern AsiaEastern EuropeEcuadorEgyptEl SalvadorEnglandEritreaEthiopiaEuropeFijiFranceGermanyGhanaGreeceGrenadaGuatemalaGuyanaHaitiHondurasHong KongHungaryIndiaIndonesiaIranIraqIrelandIsraelItalyJamaicaJapanJordanKazakhstanKenyaKoreaKuwaitLaosLatin AmericaLatviaLebanonLiberiaLithuaniaMalaysiaMexicoMicronesiaMiddle AfricaMoldovaMoroccoNepalNetherlandsNicaraguaNigeriaNorth MacedoniaNorthern AfricaNorthern EuropeNorwayOceaniaPakistanPanamaPeruPhilippinesPolandPortugalRomaniaRussiaSaudi ArabiaScotlandSenegalSerbiaSierra LeoneSingaporeSomaliaSouth AfricaSouth AmericaSouth Central AsiaSouth Eastern AsiaSouthern EuropeSpainSri LankaSt. Vincent and the GrenadinesSudanSwedenSwitzerlandSyriaTaiwanThailandTrinidad and TobagoTurkeyUgandaUkraineUruguayUzbekistanVenezuelaVietnamWest IndiesWestern AfricaWestern AsiaWestern EuropeYemenZaireZimbabwe
Income
Income (Families)
Income (Households)
Poverty
Poverty (Families)
Unemployment
Employment Occupations
Employment Industries
Employer Class
Commute Time
Commute Means
School Enrollment
Education by Degree Field
Occupancy
Finances
Physical Characteristics
Massachusetts
Compare Cities
Comparison Subject

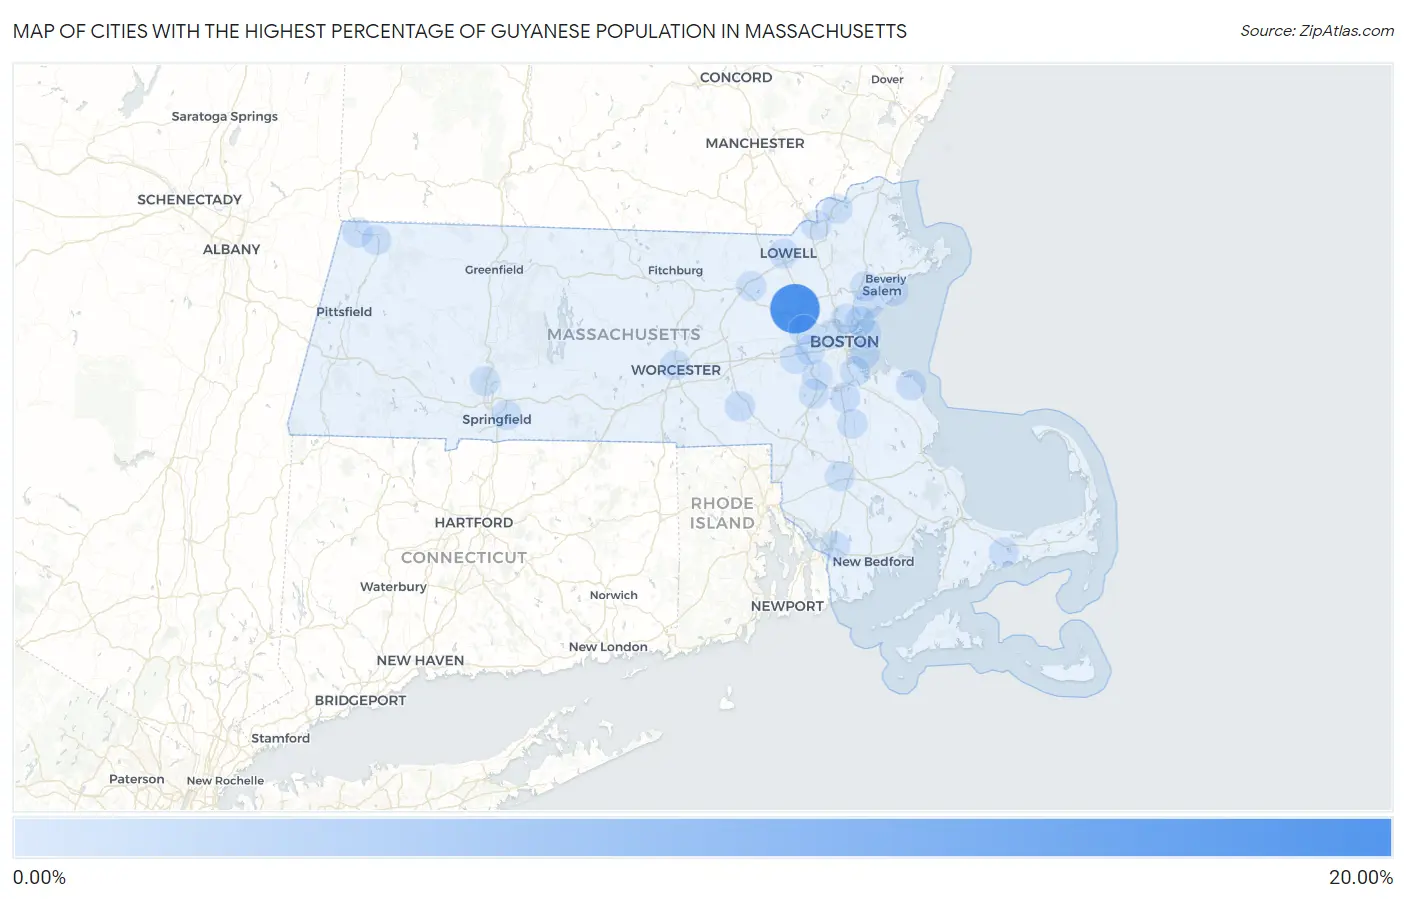
Map of Cities with the Highest Percentage of Guyanese Population in Massachusetts

0.00%
20.00%
Cities with the Highest Percentage of Guyanese Population in Massachusetts Map

Cities with the Highest Percentage of Guyanese Population in Massachusetts

City Guyanese vs State vs National
1.Hanscom Afb16.37%0.030%(+16.3)#10.078%(+16.3)#1
2.North Scituate0.33%0.030%(+0.305)#20.078%(+0.257)#358
3.Randolph Town0.18%0.030%(+0.155)#30.078%(+0.106)#530
4.Milford0.18%0.030%(+0.148)#40.078%(+0.100)#539
5.Williamstown0.13%0.030%(+0.104)#50.078%(+0.055)#627
6.Dedham0.13%0.030%(+0.098)#60.078%(+0.049)#640
7.Taunton0.12%0.030%(+0.095)#70.078%(+0.046)#645
8.Brockton0.12%0.030%(+0.089)#80.078%(+0.040)#665
9.Boston0.095%0.030%(+0.065)#90.078%(+0.017)#736
10.Wellesley0.074%0.030%(+0.044)#100.078%(-0.004)#820
11.Littleton Common0.070%0.030%(+0.040)#110.078%(-0.008)#844
12.Winthrop Town0.068%0.030%(+0.039)#120.078%(-0.010)#850
13.Barnstable Town0.067%0.030%(+0.038)#130.078%(-0.011)#855
14.Peabody0.066%0.030%(+0.037)#140.078%(-0.012)#861
15.Worcester0.064%0.030%(+0.034)#150.078%(-0.014)#868
16.Holyoke0.060%0.030%(+0.031)#160.078%(-0.018)#881
17.Methuen Town0.057%0.030%(+0.027)#170.078%(-0.021)#894
18.Norwood0.051%0.030%(+0.021)#180.078%(-0.027)#924
19.Lynn0.044%0.030%(+0.014)#190.078%(-0.034)#957
20.Revere0.041%0.030%(+0.012)#200.078%(-0.037)#971
21.Springfield0.040%0.030%(+0.010)#210.078%(-0.038)#982
22.Cambridge0.036%0.030%(+0.006)#220.078%(-0.042)#1,003
23.Malden0.032%0.030%(+0.002)#230.078%(-0.046)#1,023
24.North Adams0.031%0.030%(+0.001)#240.078%(-0.047)#1,027
25.Quincy0.025%0.030%(-0.005)#250.078%(-0.053)#1,068
26.Fall River0.016%0.030%(-0.014)#260.078%(-0.062)#1,134
27.Lowell0.013%0.030%(-0.017)#270.078%(-0.065)#1,162
28.Newton0.010%0.030%(-0.019)#280.078%(-0.068)#1,189
29.Waltham0.0093%0.030%(-0.020)#290.078%(-0.069)#1,199
30.Amherst0.0090%0.030%(-0.021)#300.078%(-0.069)#1,204
31.Salem0.0045%0.030%(-0.025)#310.078%(-0.074)#1,252
32.Haverhill0.0015%0.030%(-0.028)#320.078%(-0.077)#1,270

Common Questions

What are the Top 10 Cities with the Highest Percentage of Guyanese Population in Massachusetts?
Top 10 Cities with the Highest Percentage of Guyanese Population in Massachusetts are:
#1
16.37%
#2
0.33%
#3
0.18%
#4
0.18%
#5
0.13%
#6
0.13%
#7
0.12%
#8
0.12%
#9
0.095%
#10
0.074%
What city has the Highest Percentage of Guyanese Population in Massachusetts?
Hanscom AFB has the Highest Percentage of Guyanese Population in Massachusetts with 16.37%.
What is the Percentage of Guyanese Population in the State of Massachusetts?
Percentage of Guyanese Population in Massachusetts is 0.030%.
What is the Percentage of Guyanese Population in the United States?
Percentage of Guyanese Population in the United States is 0.078%.