Cities with the Highest Percentage of European Population in Illinois
RELATED REPORTS & OPTIONS
European
Illinois
Compare Cities
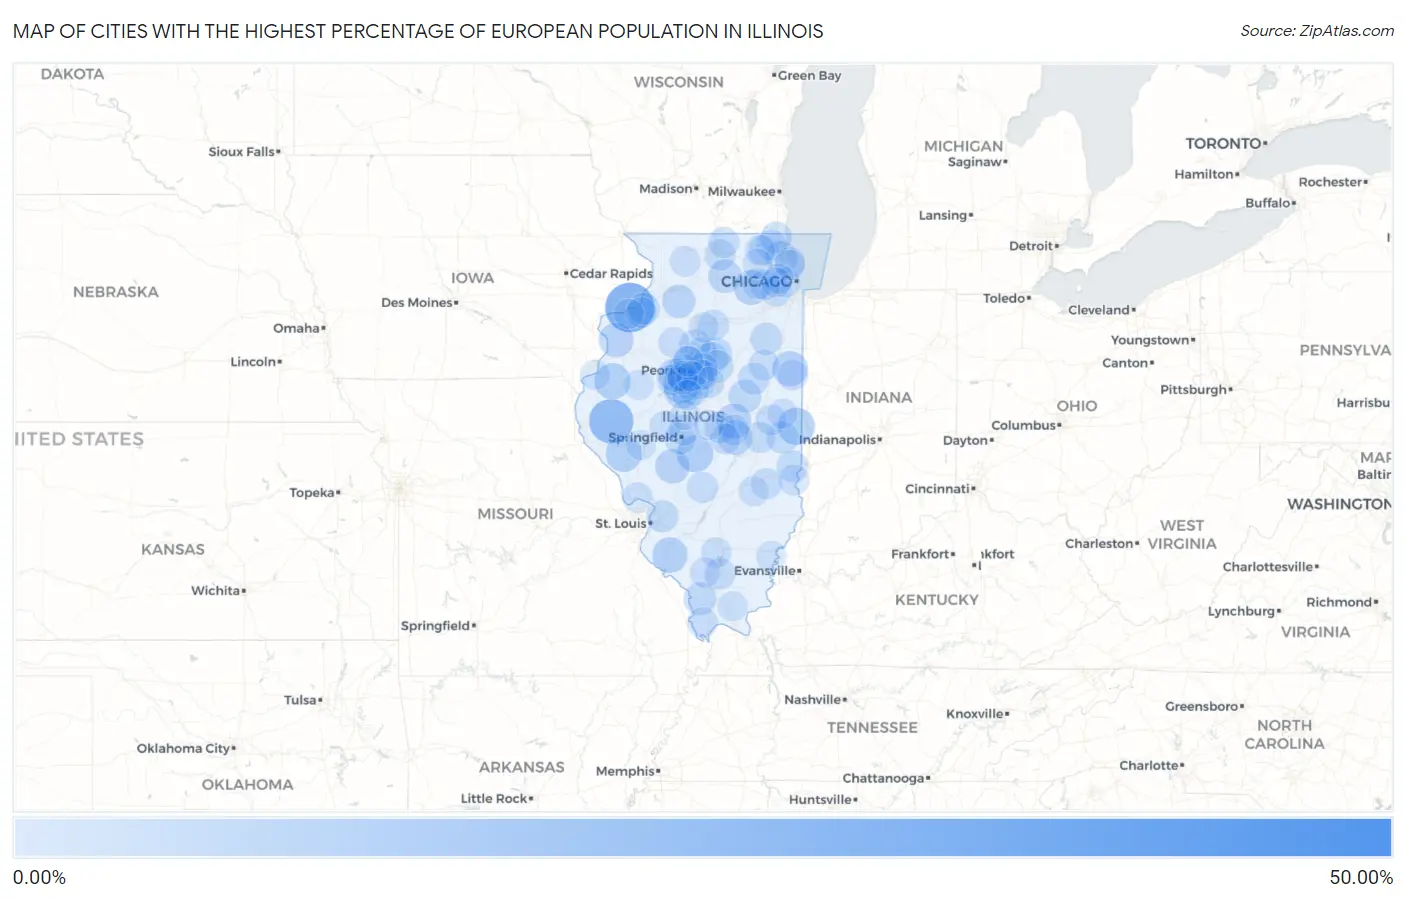
Map of Cities with the Highest Percentage of European Population in Illinois
0.00%
50.00%
Cities with the Highest Percentage of European Population in Illinois
| City | European | vs State | vs National | |
| 1. | Lynn Center | 50.00% | 1.30%(+48.7)#1 | 1.67%(+48.3)#35 |
| 2. | Rock Island Arsenal | 31.47% | 1.30%(+30.2)#2 | 1.67%(+29.8)#69 |
| 3. | Mound Station | 24.07% | 1.30%(+22.8)#3 | 1.67%(+22.4)#122 |
| 4. | Trivoli | 15.67% | 1.30%(+14.4)#4 | 1.67%(+14.0)#289 |
| 5. | Olivet | 13.75% | 1.30%(+12.4)#5 | 1.67%(+12.1)#370 |
| 6. | Creve Coeur | 13.67% | 1.30%(+12.4)#6 | 1.67%(+12.0)#377 |
| 7. | Jeisyville | 13.04% | 1.30%(+11.7)#7 | 1.67%(+11.4)#398 |
| 8. | Taylor Ridge | 12.98% | 1.30%(+11.7)#8 | 1.67%(+11.3)#400 |
| 9. | South Pekin | 12.46% | 1.30%(+11.2)#9 | 1.67%(+10.8)#437 |
| 10. | Blandinsville | 12.11% | 1.30%(+10.8)#10 | 1.67%(+10.4)#459 |
| 11. | Milton | 12.09% | 1.30%(+10.8)#11 | 1.67%(+10.4)#461 |
| 12. | Baldwin | 11.11% | 1.30%(+9.81)#12 | 1.67%(+9.44)#539 |
| 13. | Woodland | 10.97% | 1.30%(+9.66)#13 | 1.67%(+9.29)#546 |
| 14. | Prestbury | 10.71% | 1.30%(+9.41)#14 | 1.67%(+9.04)#567 |
| 15. | Cisco | 10.47% | 1.30%(+9.17)#15 | 1.67%(+8.80)#601 |
| 16. | Seaton | 10.22% | 1.30%(+8.92)#16 | 1.67%(+8.54)#631 |
| 17. | Laplace | 10.07% | 1.30%(+8.76)#17 | 1.67%(+8.39)#649 |
| 18. | Nilwood | 10.00% | 1.30%(+8.70)#18 | 1.67%(+8.33)#658 |
| 19. | Green Valley | 9.46% | 1.30%(+8.15)#19 | 1.67%(+7.78)#724 |
| 20. | Lake Camelot | 8.69% | 1.30%(+7.39)#20 | 1.67%(+7.02)#848 |
| 21. | Malta | 8.60% | 1.30%(+7.30)#21 | 1.67%(+6.93)#853 |
| 22. | Deer Grove | 8.16% | 1.30%(+6.86)#22 | 1.67%(+6.49)#942 |
| 23. | Bellflower | 7.92% | 1.30%(+6.61)#23 | 1.67%(+6.24)#987 |
| 24. | Benson | 7.85% | 1.30%(+6.54)#24 | 1.67%(+6.17)#998 |
| 25. | Alto Pass | 7.61% | 1.30%(+6.31)#25 | 1.67%(+5.94)#1,055 |
| 26. | Riverwoods | 7.29% | 1.30%(+5.98)#26 | 1.67%(+5.61)#1,129 |
| 27. | Mackinaw | 6.95% | 1.30%(+5.65)#27 | 1.67%(+5.28)#1,218 |
| 28. | Union Hill | 6.67% | 1.30%(+5.36)#28 | 1.67%(+4.99)#1,302 |
| 29. | Washburn | 6.65% | 1.30%(+5.35)#29 | 1.67%(+4.98)#1,307 |
| 30. | Hume | 6.65% | 1.30%(+5.35)#30 | 1.67%(+4.98)#1,310 |
| 31. | Cleveland | 6.47% | 1.30%(+5.17)#31 | 1.67%(+4.80)#1,354 |
| 32. | Maryville | 6.46% | 1.30%(+5.16)#32 | 1.67%(+4.79)#1,358 |
| 33. | Minonk | 6.41% | 1.30%(+5.11)#33 | 1.67%(+4.73)#1,373 |
| 34. | El Paso | 6.37% | 1.30%(+5.07)#34 | 1.67%(+4.70)#1,385 |
| 35. | Marshall | 6.19% | 1.30%(+4.89)#35 | 1.67%(+4.52)#1,462 |
| 36. | Sibley | 5.86% | 1.30%(+4.55)#36 | 1.67%(+4.18)#1,594 |
| 37. | Old Mill Creek | 5.74% | 1.30%(+4.43)#37 | 1.67%(+4.06)#1,649 |
| 38. | Jerome | 5.61% | 1.30%(+4.30)#38 | 1.67%(+3.93)#1,715 |
| 39. | Forsyth | 5.50% | 1.30%(+4.19)#39 | 1.67%(+3.82)#1,773 |
| 40. | Deer Creek | 5.46% | 1.30%(+4.16)#40 | 1.67%(+3.79)#1,792 |
| 41. | Fillmore | 5.45% | 1.30%(+4.15)#41 | 1.67%(+3.78)#1,796 |
| 42. | Cherry Valley | 5.42% | 1.30%(+4.12)#42 | 1.67%(+3.75)#1,817 |
| 43. | Lacon | 5.36% | 1.30%(+4.06)#43 | 1.67%(+3.69)#1,855 |
| 44. | Glasford | 5.31% | 1.30%(+4.01)#44 | 1.67%(+3.64)#1,889 |
| 45. | Eureka | 5.31% | 1.30%(+4.00)#45 | 1.67%(+3.63)#1,891 |
| 46. | Tallula | 5.18% | 1.30%(+3.87)#46 | 1.67%(+3.50)#1,968 |
| 47. | Tuscola | 5.16% | 1.30%(+3.86)#47 | 1.67%(+3.49)#1,979 |
| 48. | Hidalgo | 5.15% | 1.30%(+3.85)#48 | 1.67%(+3.48)#1,985 |
| 49. | Orient | 5.14% | 1.30%(+3.84)#49 | 1.67%(+3.47)#1,991 |
| 50. | Danvers | 5.10% | 1.30%(+3.80)#50 | 1.67%(+3.43)#2,017 |
| 51. | Batavia | 5.10% | 1.30%(+3.80)#51 | 1.67%(+3.43)#2,018 |
| 52. | Oglesby | 5.05% | 1.30%(+3.75)#52 | 1.67%(+3.38)#2,046 |
| 53. | Caledonia | 4.98% | 1.30%(+3.68)#53 | 1.67%(+3.30)#2,095 |
| 54. | Piper City | 4.97% | 1.30%(+3.67)#54 | 1.67%(+3.30)#2,097 |
| 55. | Spring Bay | 4.96% | 1.30%(+3.66)#55 | 1.67%(+3.28)#2,104 |
| 56. | Pekin | 4.86% | 1.30%(+3.56)#56 | 1.67%(+3.19)#2,168 |
| 57. | Milford | 4.82% | 1.30%(+3.51)#57 | 1.67%(+3.14)#2,194 |
| 58. | Cable | 4.76% | 1.30%(+3.46)#58 | 1.67%(+3.09)#2,228 |
| 59. | Wyoming | 4.74% | 1.30%(+3.43)#59 | 1.67%(+3.06)#2,244 |
| 60. | Forreston | 4.74% | 1.30%(+3.43)#60 | 1.67%(+3.06)#2,245 |
| 61. | Sidney | 4.69% | 1.30%(+3.39)#61 | 1.67%(+3.02)#2,275 |
| 62. | Cerro Gordo | 4.68% | 1.30%(+3.37)#62 | 1.67%(+3.00)#2,290 |
| 63. | West Union | 4.57% | 1.30%(+3.27)#63 | 1.67%(+2.89)#2,364 |
| 64. | Cameron | 4.53% | 1.30%(+3.23)#64 | 1.67%(+2.86)#2,410 |
| 65. | Island Lake | 4.49% | 1.30%(+3.19)#65 | 1.67%(+2.82)#2,453 |
| 66. | Hainesville | 4.48% | 1.30%(+3.18)#66 | 1.67%(+2.81)#2,461 |
| 67. | Mount Zion | 4.46% | 1.30%(+3.16)#67 | 1.67%(+2.79)#2,488 |
| 68. | Sherman | 4.44% | 1.30%(+3.14)#68 | 1.67%(+2.77)#2,501 |
| 69. | Goodfield | 4.42% | 1.30%(+3.11)#69 | 1.67%(+2.74)#2,525 |
| 70. | Winnetka | 4.40% | 1.30%(+3.10)#70 | 1.67%(+2.73)#2,534 |
| 71. | Waltonville | 4.31% | 1.30%(+3.01)#71 | 1.67%(+2.64)#2,620 |
| 72. | Tamms | 4.30% | 1.30%(+3.00)#72 | 1.67%(+2.62)#2,635 |
| 73. | Hopedale | 4.28% | 1.30%(+2.98)#73 | 1.67%(+2.61)#2,646 |
| 74. | Dowell | 4.26% | 1.30%(+2.95)#74 | 1.67%(+2.58)#2,674 |
| 75. | North Pekin | 4.25% | 1.30%(+2.95)#75 | 1.67%(+2.58)#2,678 |
| 76. | Darien | 4.23% | 1.30%(+2.93)#76 | 1.67%(+2.56)#2,706 |
| 77. | Grafton | 4.21% | 1.30%(+2.91)#77 | 1.67%(+2.54)#2,722 |
| 78. | Holcomb | 4.19% | 1.30%(+2.89)#78 | 1.67%(+2.52)#2,743 |
| 79. | North Riverside | 4.15% | 1.30%(+2.85)#79 | 1.67%(+2.48)#2,775 |
| 80. | Wilmette | 4.14% | 1.30%(+2.84)#80 | 1.67%(+2.47)#2,794 |
| 81. | Bay View Gardens | 4.09% | 1.30%(+2.79)#81 | 1.67%(+2.42)#2,850 |
| 82. | Colona | 4.05% | 1.30%(+2.75)#82 | 1.67%(+2.38)#2,899 |
| 83. | Dieterich | 4.03% | 1.30%(+2.72)#83 | 1.67%(+2.35)#2,923 |
| 84. | Crossville | 4.03% | 1.30%(+2.72)#84 | 1.67%(+2.35)#2,925 |
| 85. | Warrenville | 4.02% | 1.30%(+2.72)#85 | 1.67%(+2.35)#2,933 |
| 86. | Morton | 4.02% | 1.30%(+2.71)#86 | 1.67%(+2.34)#2,938 |
| 87. | Prairie Grove | 4.02% | 1.30%(+2.71)#87 | 1.67%(+2.34)#2,939 |
| 88. | Middletown | 3.94% | 1.30%(+2.63)#88 | 1.67%(+2.26)#3,033 |
| 89. | West Dundee | 3.90% | 1.30%(+2.60)#89 | 1.67%(+2.23)#3,084 |
| 90. | Lynnville | 3.88% | 1.30%(+2.57)#90 | 1.67%(+2.20)#3,115 |
| 91. | Simpson | 3.85% | 1.30%(+2.54)#91 | 1.67%(+2.17)#3,159 |
| 92. | Fithian | 3.81% | 1.30%(+2.51)#92 | 1.67%(+2.14)#3,203 |
| 93. | Elmhurst | 3.81% | 1.30%(+2.50)#93 | 1.67%(+2.13)#3,211 |
| 94. | Delavan | 3.81% | 1.30%(+2.50)#94 | 1.67%(+2.13)#3,213 |
| 95. | Oakbrook Terrace | 3.78% | 1.30%(+2.48)#95 | 1.67%(+2.11)#3,243 |
| 96. | Dallas City | 3.78% | 1.30%(+2.48)#96 | 1.67%(+2.11)#3,247 |
| 97. | Latham | 3.78% | 1.30%(+2.47)#97 | 1.67%(+2.10)#3,256 |
| 98. | Mark | 3.77% | 1.30%(+2.46)#98 | 1.67%(+2.09)#3,270 |
| 99. | Marietta | 3.70% | 1.30%(+2.40)#99 | 1.67%(+2.03)#3,347 |
| 100. | Milan | 3.67% | 1.30%(+2.37)#100 | 1.67%(+2.00)#3,394 |
Common Questions
What are the Top 10 Cities with the Highest Percentage of European Population in Illinois?
Top 10 Cities with the Highest Percentage of European Population in Illinois are:
#1
31.47%
#2
24.07%
#3
13.75%
#4
13.67%
#5
13.04%
#6
12.46%
#7
12.11%
#8
12.09%
#9
11.11%
#10
10.97%
What city has the Highest Percentage of European Population in Illinois?
Rock Island Arsenal has the Highest Percentage of European Population in Illinois with 31.47%.
What is the Percentage of European Population in the State of Illinois?
Percentage of European Population in Illinois is 1.30%.
What is the Percentage of European Population in the United States?
Percentage of European Population in the United States is 1.67%.