Cities with the Highest Percentage of European Population in Connecticut
RELATED REPORTS & OPTIONS
European
Connecticut
Compare Cities
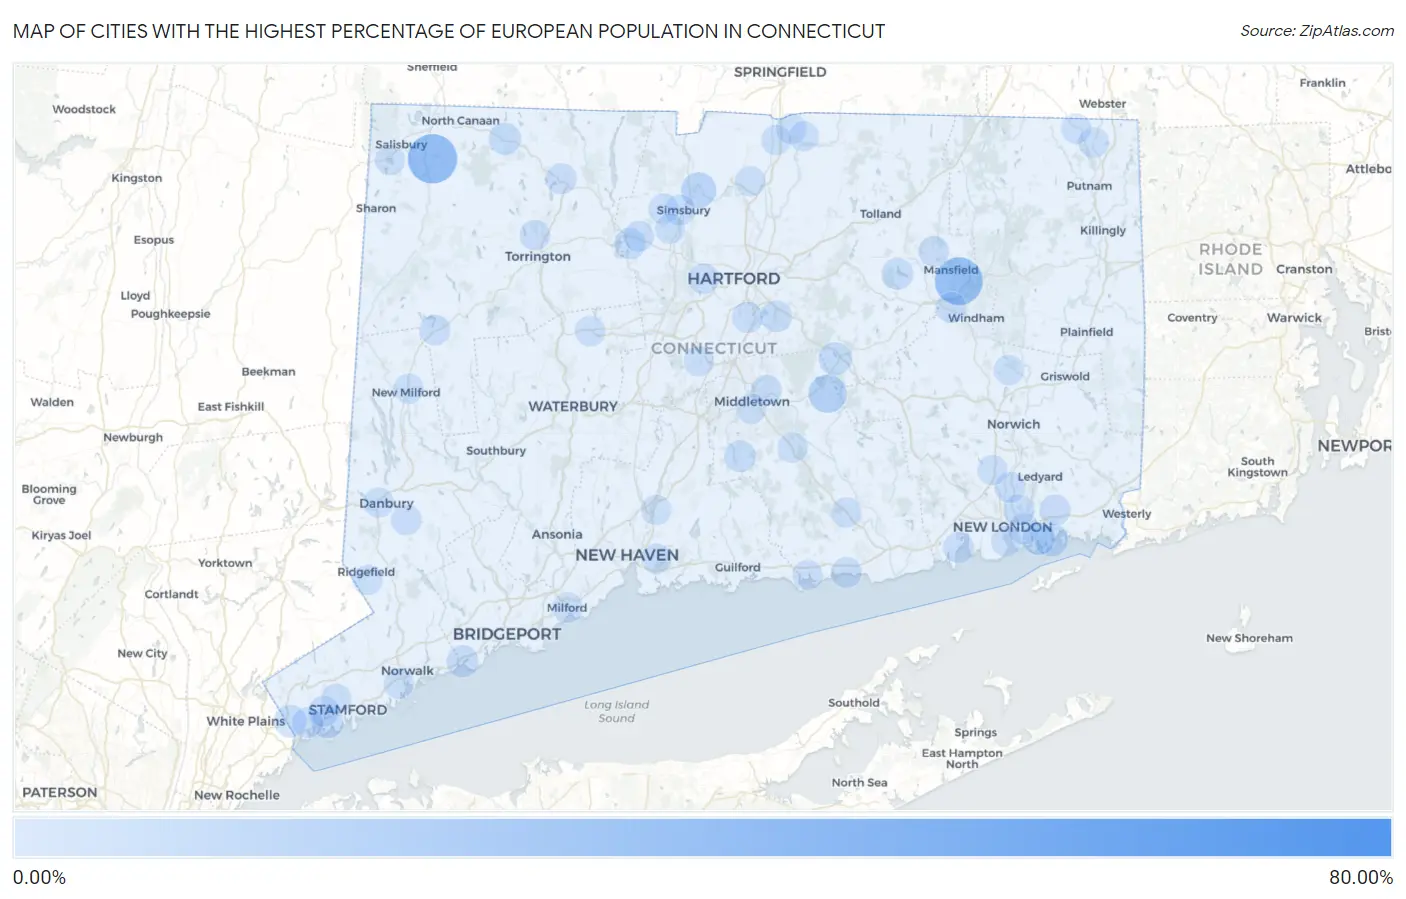
Map of Cities with the Highest Percentage of European Population in Connecticut
0.00%
80.00%
Cities with the Highest Percentage of European Population in Connecticut
| City | European | vs State | vs National | |
| 1. | Sherman | 69.70% | 1.04%(+68.7)#1 | 1.67%(+68.0)#15 |
| 2. | Falls Village | 29.39% | 1.04%(+28.3)#2 | 1.67%(+27.7)#89 |
| 3. | Mansfield Center | 26.85% | 1.04%(+25.8)#3 | 1.67%(+25.2)#102 |
| 4. | East Hampton | 12.53% | 1.04%(+11.5)#4 | 1.67%(+10.9)#429 |
| 5. | Witches Woods | 11.59% | 1.04%(+10.5)#5 | 1.67%(+9.91)#494 |
| 6. | Quasset Lake | 9.84% | 1.04%(+8.79)#6 | 1.67%(+8.16)#675 |
| 7. | Tariffville | 8.15% | 1.04%(+7.11)#7 | 1.67%(+6.48)#945 |
| 8. | West Cornwall | 7.41% | 1.04%(+6.37)#8 | 1.67%(+5.73)#1,098 |
| 9. | Oronoque | 6.42% | 1.04%(+5.38)#9 | 1.67%(+4.75)#1,370 |
| 10. | Old Hill | 5.36% | 1.04%(+4.32)#10 | 1.67%(+3.68)#1,859 |
| 11. | Indian Field | 5.32% | 1.04%(+4.28)#11 | 1.67%(+3.65)#1,882 |
| 12. | Litchfield Borough | 5.31% | 1.04%(+4.27)#12 | 1.67%(+3.64)#1,887 |
| 13. | Greens Farms | 5.18% | 1.04%(+4.14)#13 | 1.67%(+3.51)#1,964 |
| 14. | Noank | 5.09% | 1.04%(+4.05)#14 | 1.67%(+3.42)#2,022 |
| 15. | Coleytown | 5.01% | 1.04%(+3.97)#15 | 1.67%(+3.34)#2,066 |
| 16. | Terramuggus | 4.76% | 1.04%(+3.71)#16 | 1.67%(+3.08)#2,232 |
| 17. | Poquonock Bridge | 4.46% | 1.04%(+3.42)#17 | 1.67%(+2.79)#2,489 |
| 18. | Weston | 4.39% | 1.04%(+3.35)#18 | 1.67%(+2.72)#2,545 |
| 19. | Glenville | 4.11% | 1.04%(+3.07)#19 | 1.67%(+2.44)#2,828 |
| 20. | Norfolk | 3.83% | 1.04%(+2.79)#20 | 1.67%(+2.16)#3,171 |
| 21. | Southport | 3.43% | 1.04%(+2.39)#21 | 1.67%(+1.76)#3,715 |
| 22. | Tokeneke | 3.38% | 1.04%(+2.34)#22 | 1.67%(+1.70)#3,789 |
| 23. | Durham | 3.32% | 1.04%(+2.27)#23 | 1.67%(+1.64)#3,896 |
| 24. | Lakes East | 3.02% | 1.04%(+1.98)#24 | 1.67%(+1.35)#4,425 |
| 25. | Compo | 2.94% | 1.04%(+1.90)#25 | 1.67%(+1.27)#4,583 |
| 26. | Coventry Lake | 2.91% | 1.04%(+1.87)#26 | 1.67%(+1.24)#4,642 |
| 27. | Poplar Plains | 2.80% | 1.04%(+1.75)#27 | 1.67%(+1.12)#4,914 |
| 28. | Noroton Heights | 2.76% | 1.04%(+1.72)#28 | 1.67%(+1.09)#4,990 |
| 29. | Riverside | 2.76% | 1.04%(+1.72)#29 | 1.67%(+1.09)#4,992 |
| 30. | Glastonbury Center | 2.60% | 1.04%(+1.56)#30 | 1.67%(+0.927)#5,397 |
| 31. | Fenwick Borough | 2.50% | 1.04%(+1.46)#31 | 1.67%(+0.826)#5,666 |
| 32. | Collinsville | 2.32% | 1.04%(+1.28)#32 | 1.67%(+0.646)#6,229 |
| 33. | Noroton | 2.18% | 1.04%(+1.14)#33 | 1.67%(+0.502)#6,710 |
| 34. | Bantam Borough | 2.15% | 1.04%(+1.11)#34 | 1.67%(+0.478)#6,799 |
| 35. | Staples | 2.04% | 1.04%(+1.00)#35 | 1.67%(+0.367)#7,206 |
| 36. | New Canaan | 2.04% | 1.04%(+0.998)#36 | 1.67%(+0.366)#7,215 |
| 37. | Old Mystic | 2.04% | 1.04%(+0.997)#37 | 1.67%(+0.364)#7,219 |
| 38. | Long Hill | 1.97% | 1.04%(+0.927)#38 | 1.67%(+0.295)#7,478 |
| 39. | Conning Towers Nautilus Park | 1.97% | 1.04%(+0.927)#39 | 1.67%(+0.294)#7,479 |
| 40. | Candlewood Isle | 1.93% | 1.04%(+0.886)#40 | 1.67%(+0.253)#7,638 |
| 41. | Stonington Borough | 1.91% | 1.04%(+0.869)#41 | 1.67%(+0.237)#7,697 |
| 42. | Winsted | 1.87% | 1.04%(+0.833)#42 | 1.67%(+0.201)#7,838 |
| 43. | Niantic | 1.86% | 1.04%(+0.817)#43 | 1.67%(+0.184)#7,904 |
| 44. | Wethersfield | 1.85% | 1.04%(+0.812)#44 | 1.67%(+0.179)#7,927 |
| 45. | South Wilton | 1.82% | 1.04%(+0.779)#45 | 1.67%(+0.146)#8,076 |
| 46. | Cos Cob | 1.77% | 1.04%(+0.726)#46 | 1.67%(+0.093)#8,315 |
| 47. | Newtown Borough | 1.63% | 1.04%(+0.592)#47 | 1.67%(-0.041)#8,935 |
| 48. | West Hartford | 1.63% | 1.04%(+0.589)#48 | 1.67%(-0.044)#8,948 |
| 49. | Lordship | 1.58% | 1.04%(+0.543)#49 | 1.67%(-0.090)#9,161 |
| 50. | Westbrook Center | 1.55% | 1.04%(+0.512)#50 | 1.67%(-0.121)#9,306 |
| 51. | Gales Ferry | 1.44% | 1.04%(+0.396)#51 | 1.67%(-0.237)#9,874 |
| 52. | Storrs | 1.43% | 1.04%(+0.390)#52 | 1.67%(-0.243)#9,910 |
| 53. | Stepney | 1.42% | 1.04%(+0.374)#53 | 1.67%(-0.259)#9,999 |
| 54. | Canton Valley | 1.42% | 1.04%(+0.374)#54 | 1.67%(-0.259)#10,000 |
| 55. | Willimantic | 1.40% | 1.04%(+0.360)#55 | 1.67%(-0.272)#10,077 |
| 56. | Westport | 1.35% | 1.04%(+0.308)#56 | 1.67%(-0.325)#10,382 |
| 57. | Greenwich | 1.32% | 1.04%(+0.282)#57 | 1.67%(-0.351)#10,525 |
| 58. | Naugatuck Borough | 1.30% | 1.04%(+0.263)#58 | 1.67%(-0.370)#10,631 |
| 59. | Torrington | 1.29% | 1.04%(+0.245)#59 | 1.67%(-0.387)#10,726 |
| 60. | Portland | 1.28% | 1.04%(+0.236)#60 | 1.67%(-0.396)#10,778 |
| 61. | Simsbury Center | 1.28% | 1.04%(+0.235)#61 | 1.67%(-0.398)#10,789 |
| 62. | New Preston | 1.27% | 1.04%(+0.225)#62 | 1.67%(-0.407)#10,847 |
| 63. | Bethel | 1.24% | 1.04%(+0.196)#63 | 1.67%(-0.436)#11,005 |
| 64. | Sherwood Manor | 1.19% | 1.04%(+0.145)#64 | 1.67%(-0.488)#11,302 |
| 65. | New London | 1.13% | 1.04%(+0.085)#65 | 1.67%(-0.547)#11,650 |
| 66. | Windsor Locks | 1.12% | 1.04%(+0.081)#66 | 1.67%(-0.552)#11,678 |
| 67. | North Grosvenor Dale | 1.09% | 1.04%(+0.051)#67 | 1.67%(-0.581)#11,844 |
| 68. | Milford City Balance | 1.09% | 1.04%(+0.046)#68 | 1.67%(-0.587)#11,870 |
| 69. | Fairfield University | 1.07% | 1.04%(+0.031)#69 | 1.67%(-0.601)#11,951 |
| 70. | Baltic | 1.04% | 1.04%(+0.002)#70 | 1.67%(-0.631)#12,136 |
| 71. | Route 7 Gateway | 0.99% | 1.04%(-0.051)#71 | 1.67%(-0.683)#12,473 |
| 72. | Northford | 0.99% | 1.04%(-0.056)#72 | 1.67%(-0.689)#12,515 |
| 73. | West Simsbury | 0.97% | 1.04%(-0.076)#73 | 1.67%(-0.709)#12,655 |
| 74. | Sandy Hook | 0.93% | 1.04%(-0.115)#74 | 1.67%(-0.748)#12,901 |
| 75. | Middletown | 0.91% | 1.04%(-0.134)#75 | 1.67%(-0.767)#13,026 |
| 76. | Oxoboxo River | 0.91% | 1.04%(-0.136)#76 | 1.67%(-0.769)#13,035 |
| 77. | Higganum | 0.89% | 1.04%(-0.156)#77 | 1.67%(-0.788)#13,158 |
| 78. | Lakes West | 0.88% | 1.04%(-0.158)#78 | 1.67%(-0.791)#13,181 |
| 79. | Terryville | 0.88% | 1.04%(-0.161)#79 | 1.67%(-0.794)#13,193 |
| 80. | New Milford | 0.87% | 1.04%(-0.168)#80 | 1.67%(-0.800)#13,224 |
| 81. | East Haven | 0.86% | 1.04%(-0.184)#81 | 1.67%(-0.817)#13,332 |
| 82. | Darien Downtown | 0.85% | 1.04%(-0.192)#82 | 1.67%(-0.825)#13,395 |
| 83. | Stamford | 0.84% | 1.04%(-0.200)#83 | 1.67%(-0.832)#13,449 |
| 84. | Ball Pond | 0.83% | 1.04%(-0.212)#84 | 1.67%(-0.845)#13,523 |
| 85. | Danbury | 0.82% | 1.04%(-0.223)#85 | 1.67%(-0.855)#13,607 |
| 86. | Deep River Center | 0.81% | 1.04%(-0.227)#86 | 1.67%(-0.859)#13,637 |
| 87. | Lakeville | 0.79% | 1.04%(-0.252)#87 | 1.67%(-0.884)#13,817 |
| 88. | Groton Long Point Borough | 0.77% | 1.04%(-0.268)#88 | 1.67%(-0.901)#13,957 |
| 89. | Jewett City Borough | 0.76% | 1.04%(-0.280)#89 | 1.67%(-0.913)#14,047 |
| 90. | Hazardville | 0.75% | 1.04%(-0.290)#90 | 1.67%(-0.923)#14,110 |
| 91. | Norwalk | 0.74% | 1.04%(-0.298)#91 | 1.67%(-0.931)#14,162 |
| 92. | Quinebaug | 0.74% | 1.04%(-0.302)#92 | 1.67%(-0.934)#14,184 |
| 93. | North Haven | 0.73% | 1.04%(-0.310)#93 | 1.67%(-0.942)#14,237 |
| 94. | Ridgefield | 0.73% | 1.04%(-0.310)#94 | 1.67%(-0.943)#14,241 |
| 95. | Kensington | 0.70% | 1.04%(-0.342)#95 | 1.67%(-0.975)#14,492 |
| 96. | Thompsonville | 0.69% | 1.04%(-0.350)#96 | 1.67%(-0.983)#14,562 |
| 97. | Clinton | 0.67% | 1.04%(-0.367)#97 | 1.67%(-1.000)#14,699 |
| 98. | Weatogue | 0.67% | 1.04%(-0.368)#98 | 1.67%(-1.00)#14,708 |
| 99. | Quinnipiac University | 0.65% | 1.04%(-0.392)#99 | 1.67%(-1.02)#14,891 |
| 100. | Danielson Borough | 0.65% | 1.04%(-0.393)#100 | 1.67%(-1.03)#14,899 |
Common Questions
What are the Top 10 Cities with the Highest Percentage of European Population in Connecticut?
Top 10 Cities with the Highest Percentage of European Population in Connecticut are:
#1
29.39%
#2
26.85%
#3
12.53%
#4
8.15%
#5
5.09%
#6
4.76%
#7
4.46%
#8
4.11%
#9
3.83%
#10
3.43%
What city has the Highest Percentage of European Population in Connecticut?
Falls Village has the Highest Percentage of European Population in Connecticut with 29.39%.
What is the Percentage of European Population in the State of Connecticut?
Percentage of European Population in Connecticut is 1.04%.
What is the Percentage of European Population in the United States?
Percentage of European Population in the United States is 1.67%.