Cities with the Highest Percentage of European Population in Pennsylvania
RELATED REPORTS & OPTIONS
European
Pennsylvania
Compare Cities
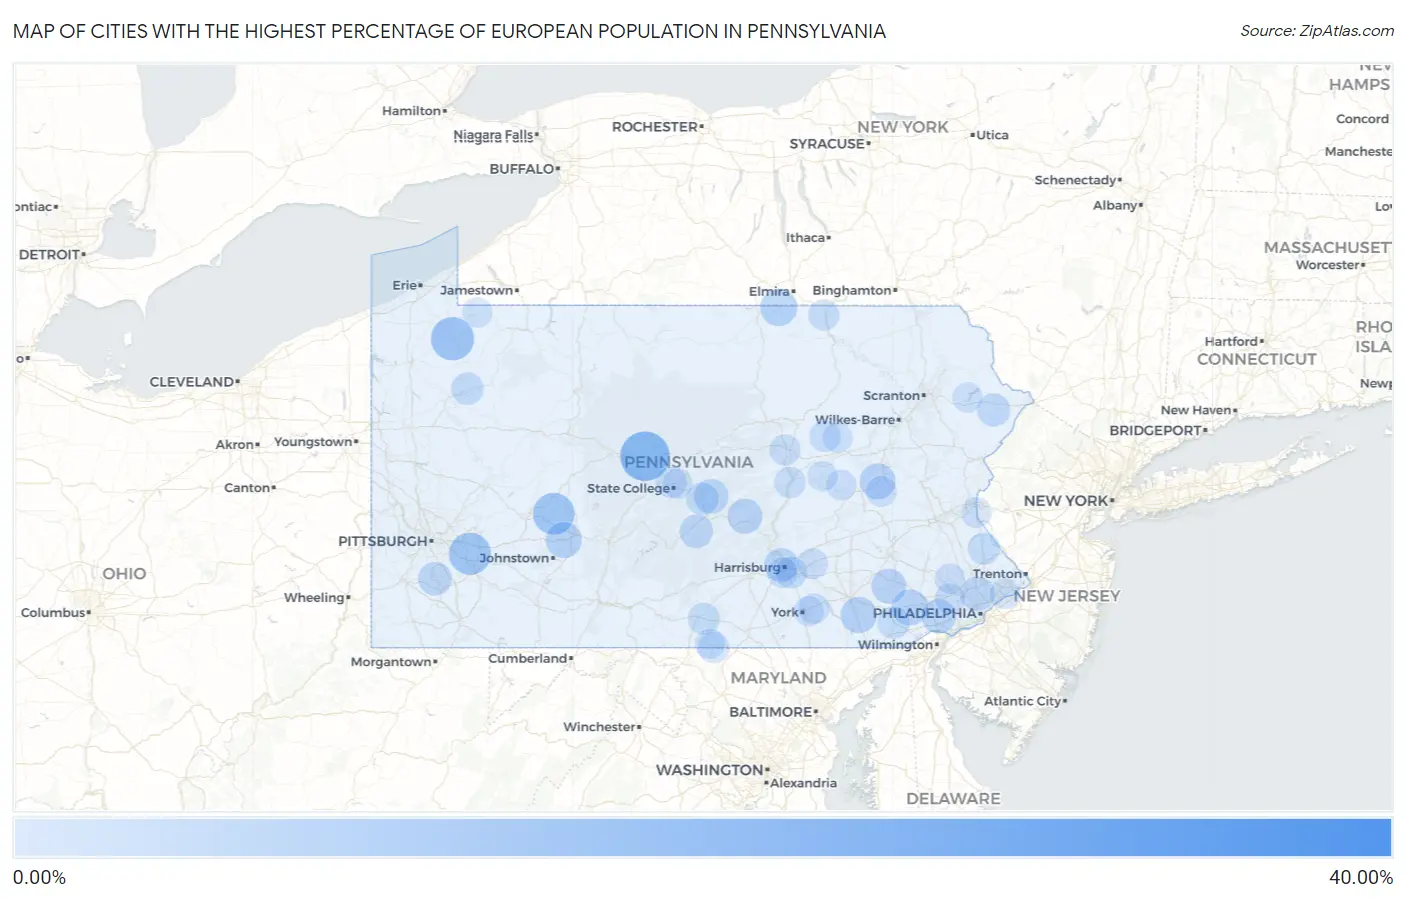
Map of Cities with the Highest Percentage of European Population in Pennsylvania
0.00%
40.00%
Cities with the Highest Percentage of European Population in Pennsylvania
| City | European | vs State | vs National | |
| 1. | Brooks Mill | 39.18% | 1.11%(+38.1)#1 | 1.67%(+37.5)#55 |
| 2. | Grassflat | 22.41% | 1.11%(+21.3)#2 | 1.67%(+20.7)#142 |
| 3. | Armagh Borough | 20.45% | 1.11%(+19.3)#3 | 1.67%(+18.8)#174 |
| 4. | Railroad Borough | 16.51% | 1.11%(+15.4)#4 | 1.67%(+14.8)#251 |
| 5. | Riceville | 16.36% | 1.11%(+15.2)#5 | 1.67%(+14.7)#259 |
| 6. | Harrison City | 15.19% | 1.11%(+14.1)#6 | 1.67%(+13.5)#307 |
| 7. | Heilwood | 14.96% | 1.11%(+13.8)#7 | 1.67%(+13.3)#320 |
| 8. | Chester Heights Borough | 12.63% | 1.11%(+11.5)#8 | 1.67%(+11.0)#420 |
| 9. | Rices Landing Borough | 11.18% | 1.11%(+10.1)#9 | 1.67%(+9.51)#535 |
| 10. | Silverdale Borough | 10.46% | 1.11%(+9.35)#10 | 1.67%(+8.79)#603 |
| 11. | Millerton | 10.36% | 1.11%(+9.25)#11 | 1.67%(+8.69)#617 |
| 12. | Mundys Corner | 9.54% | 1.11%(+8.43)#12 | 1.67%(+7.87)#708 |
| 13. | Refton | 9.53% | 1.11%(+8.42)#13 | 1.67%(+7.86)#710 |
| 14. | Caln | 9.43% | 1.11%(+8.32)#14 | 1.67%(+7.76)#729 |
| 15. | Delano | 9.35% | 1.11%(+8.23)#15 | 1.67%(+7.67)#746 |
| 16. | Friendsville Borough | 9.15% | 1.11%(+8.03)#16 | 1.67%(+7.47)#767 |
| 17. | Masontown Borough | 9.10% | 1.11%(+7.99)#17 | 1.67%(+7.43)#772 |
| 18. | Oswayo Borough | 8.82% | 1.11%(+7.71)#18 | 1.67%(+7.15)#822 |
| 19. | East Salem | 8.51% | 1.11%(+7.40)#19 | 1.67%(+6.84)#870 |
| 20. | Penn Borough | 8.42% | 1.11%(+7.31)#20 | 1.67%(+6.75)#891 |
| 21. | Churchtown | 8.41% | 1.11%(+7.29)#21 | 1.67%(+6.73)#895 |
| 22. | Berrysburg Borough | 8.19% | 1.11%(+7.08)#22 | 1.67%(+6.52)#939 |
| 23. | Siglerville | 8.12% | 1.11%(+7.01)#23 | 1.67%(+6.45)#948 |
| 24. | Allenport Borough | 7.94% | 1.11%(+6.83)#24 | 1.67%(+6.27)#980 |
| 25. | Birmingham Borough | 7.94% | 1.11%(+6.82)#25 | 1.67%(+6.26)#981 |
| 26. | Cheyney University | 7.89% | 1.11%(+6.78)#26 | 1.67%(+6.22)#990 |
| 27. | Wyndmoor | 7.79% | 1.11%(+6.68)#27 | 1.67%(+6.12)#1,018 |
| 28. | Hunker Borough | 7.65% | 1.11%(+6.53)#28 | 1.67%(+5.97)#1,050 |
| 29. | West Fairview | 7.52% | 1.11%(+6.41)#29 | 1.67%(+5.85)#1,077 |
| 30. | Alexandria Borough | 7.32% | 1.11%(+6.20)#30 | 1.67%(+5.64)#1,120 |
| 31. | Baidland | 7.23% | 1.11%(+6.12)#31 | 1.67%(+5.56)#1,143 |
| 32. | Longfellow | 7.22% | 1.11%(+6.10)#32 | 1.67%(+5.54)#1,153 |
| 33. | Hop Bottom Borough | 7.07% | 1.11%(+5.96)#33 | 1.67%(+5.40)#1,188 |
| 34. | Hemlock Farms | 6.83% | 1.11%(+5.71)#34 | 1.67%(+5.15)#1,254 |
| 35. | Venango Borough | 6.79% | 1.11%(+5.67)#35 | 1.67%(+5.11)#1,271 |
| 36. | Hastings Borough | 6.66% | 1.11%(+5.55)#36 | 1.67%(+4.99)#1,306 |
| 37. | Potlicker Flats | 6.38% | 1.11%(+5.27)#37 | 1.67%(+4.71)#1,382 |
| 38. | Greencastle Borough | 6.35% | 1.11%(+5.24)#38 | 1.67%(+4.68)#1,395 |
| 39. | Eddystone Borough | 6.27% | 1.11%(+5.15)#39 | 1.67%(+4.59)#1,428 |
| 40. | Vandling Borough | 6.17% | 1.11%(+5.06)#40 | 1.67%(+4.50)#1,468 |
| 41. | Green Lane Borough | 6.13% | 1.11%(+5.02)#41 | 1.67%(+4.46)#1,481 |
| 42. | Hasson Heights | 6.06% | 1.11%(+4.94)#42 | 1.67%(+4.38)#1,502 |
| 43. | Stockertown Borough | 6.04% | 1.11%(+4.92)#43 | 1.67%(+4.36)#1,509 |
| 44. | Hayti | 6.00% | 1.11%(+4.89)#44 | 1.67%(+4.33)#1,525 |
| 45. | Cochranville | 5.94% | 1.11%(+4.83)#45 | 1.67%(+4.27)#1,554 |
| 46. | Mcewensville Borough | 5.90% | 1.11%(+4.79)#46 | 1.67%(+4.23)#1,572 |
| 47. | Emsworth Borough | 5.71% | 1.11%(+4.59)#47 | 1.67%(+4.03)#1,663 |
| 48. | Ligonier Borough | 5.70% | 1.11%(+4.58)#48 | 1.67%(+4.02)#1,668 |
| 49. | Ingram Borough | 5.67% | 1.11%(+4.56)#49 | 1.67%(+4.00)#1,683 |
| 50. | Laurel Mountain Borough | 5.66% | 1.11%(+4.55)#50 | 1.67%(+3.99)#1,688 |
| 51. | Plumsteadville | 5.65% | 1.11%(+4.54)#51 | 1.67%(+3.98)#1,692 |
| 52. | Guilford | 5.54% | 1.11%(+4.42)#52 | 1.67%(+3.86)#1,755 |
| 53. | Oakland Cdp Lawrence County | 5.53% | 1.11%(+4.42)#53 | 1.67%(+3.86)#1,758 |
| 54. | Pleasureville | 5.43% | 1.11%(+4.32)#54 | 1.67%(+3.76)#1,811 |
| 55. | Enhaut | 5.43% | 1.11%(+4.32)#55 | 1.67%(+3.76)#1,812 |
| 56. | Hummels Wharf | 5.20% | 1.11%(+4.08)#56 | 1.67%(+3.52)#1,952 |
| 57. | Clifton Heights Borough | 5.19% | 1.11%(+4.08)#57 | 1.67%(+3.52)#1,954 |
| 58. | Manor Borough | 5.19% | 1.11%(+4.07)#58 | 1.67%(+3.51)#1,959 |
| 59. | Glen Osborne Borough | 5.18% | 1.11%(+4.07)#59 | 1.67%(+3.51)#1,965 |
| 60. | Stockdale Borough | 5.14% | 1.11%(+4.02)#60 | 1.67%(+3.46)#1,995 |
| 61. | Iola | 5.11% | 1.11%(+4.00)#61 | 1.67%(+3.44)#2,010 |
| 62. | Pen Mar | 5.10% | 1.11%(+3.98)#62 | 1.67%(+3.42)#2,020 |
| 63. | Toftrees | 5.05% | 1.11%(+3.94)#63 | 1.67%(+3.38)#2,045 |
| 64. | West Sunbury Borough | 5.00% | 1.11%(+3.89)#64 | 1.67%(+3.33)#2,075 |
| 65. | New Columbia | 4.91% | 1.11%(+3.80)#65 | 1.67%(+3.24)#2,134 |
| 66. | Dauphin Borough | 4.90% | 1.11%(+3.78)#66 | 1.67%(+3.22)#2,139 |
| 67. | Greens Landing | 4.81% | 1.11%(+3.70)#67 | 1.67%(+3.14)#2,197 |
| 68. | Delta Borough | 4.79% | 1.11%(+3.68)#68 | 1.67%(+3.12)#2,209 |
| 69. | Hershey | 4.75% | 1.11%(+3.63)#69 | 1.67%(+3.07)#2,239 |
| 70. | Tuscarora | 4.70% | 1.11%(+3.59)#70 | 1.67%(+3.03)#2,267 |
| 71. | Brisbin Borough | 4.65% | 1.11%(+3.54)#71 | 1.67%(+2.98)#2,304 |
| 72. | Youngwood Borough | 4.50% | 1.11%(+3.39)#72 | 1.67%(+2.83)#2,448 |
| 73. | Eddington | 4.48% | 1.11%(+3.37)#73 | 1.67%(+2.81)#2,462 |
| 74. | Stonybrook | 4.45% | 1.11%(+3.33)#74 | 1.67%(+2.77)#2,498 |
| 75. | Devon | 4.44% | 1.11%(+3.33)#75 | 1.67%(+2.77)#2,499 |
| 76. | Sewickley Borough | 4.44% | 1.11%(+3.33)#76 | 1.67%(+2.77)#2,502 |
| 77. | Addison Borough | 4.41% | 1.11%(+3.30)#77 | 1.67%(+2.74)#2,527 |
| 78. | Lower Allen | 4.35% | 1.11%(+3.24)#78 | 1.67%(+2.68)#2,583 |
| 79. | Athens Borough | 4.34% | 1.11%(+3.23)#79 | 1.67%(+2.67)#2,594 |
| 80. | Evansburg | 4.33% | 1.11%(+3.22)#80 | 1.67%(+2.66)#2,607 |
| 81. | Elgin Borough | 4.31% | 1.11%(+3.20)#81 | 1.67%(+2.64)#2,622 |
| 82. | Blooming Valley Borough | 4.28% | 1.11%(+3.16)#82 | 1.67%(+2.60)#2,654 |
| 83. | Spring City Borough | 4.27% | 1.11%(+3.16)#83 | 1.67%(+2.60)#2,659 |
| 84. | Starrucca Borough | 4.27% | 1.11%(+3.15)#84 | 1.67%(+2.59)#2,663 |
| 85. | Millersville Borough | 4.24% | 1.11%(+3.12)#85 | 1.67%(+2.56)#2,698 |
| 86. | Raubsville | 4.23% | 1.11%(+3.11)#86 | 1.67%(+2.55)#2,712 |
| 87. | Wilburton Number One | 4.22% | 1.11%(+3.11)#87 | 1.67%(+2.55)#2,715 |
| 88. | Camp Hill Borough | 4.21% | 1.11%(+3.09)#88 | 1.67%(+2.53)#2,729 |
| 89. | Elysburg | 4.20% | 1.11%(+3.09)#89 | 1.67%(+2.53)#2,731 |
| 90. | Wallenpaupack Lake Estates | 4.19% | 1.11%(+3.07)#90 | 1.67%(+2.51)#2,750 |
| 91. | Rohrsburg | 4.14% | 1.11%(+3.03)#91 | 1.67%(+2.47)#2,792 |
| 92. | Yardley Borough | 4.09% | 1.11%(+2.98)#92 | 1.67%(+2.42)#2,856 |
| 93. | Swarthmore Borough | 4.09% | 1.11%(+2.97)#93 | 1.67%(+2.41)#2,863 |
| 94. | Parkesburg Borough | 4.06% | 1.11%(+2.95)#94 | 1.67%(+2.39)#2,890 |
| 95. | Wayne Heights | 4.00% | 1.11%(+2.89)#95 | 1.67%(+2.33)#2,951 |
| 96. | Columbus | 4.00% | 1.11%(+2.88)#96 | 1.67%(+2.32)#2,965 |
| 97. | Townville Borough | 3.97% | 1.11%(+2.86)#97 | 1.67%(+2.30)#2,987 |
| 98. | Houserville | 3.96% | 1.11%(+2.85)#98 | 1.67%(+2.29)#3,004 |
| 99. | Waynesboro Borough | 3.93% | 1.11%(+2.82)#99 | 1.67%(+2.26)#3,040 |
| 100. | East York | 3.92% | 1.11%(+2.81)#100 | 1.67%(+2.25)#3,058 |
Common Questions
What are the Top 10 Cities with the Highest Percentage of European Population in Pennsylvania?
Top 10 Cities with the Highest Percentage of European Population in Pennsylvania are:
#1
22.41%
#2
16.36%
#3
15.19%
#4
14.96%
#5
10.36%
#6
9.54%
#7
9.53%
#8
9.43%
#9
9.35%
#10
8.51%
What city has the Highest Percentage of European Population in Pennsylvania?
Grassflat has the Highest Percentage of European Population in Pennsylvania with 22.41%.
What is the Percentage of European Population in the State of Pennsylvania?
Percentage of European Population in Pennsylvania is 1.11%.
What is the Percentage of European Population in the United States?
Percentage of European Population in the United States is 1.67%.