Cities with the Highest Percentage of European Population in Oklahoma
RELATED REPORTS & OPTIONS
European
Oklahoma
Compare Cities
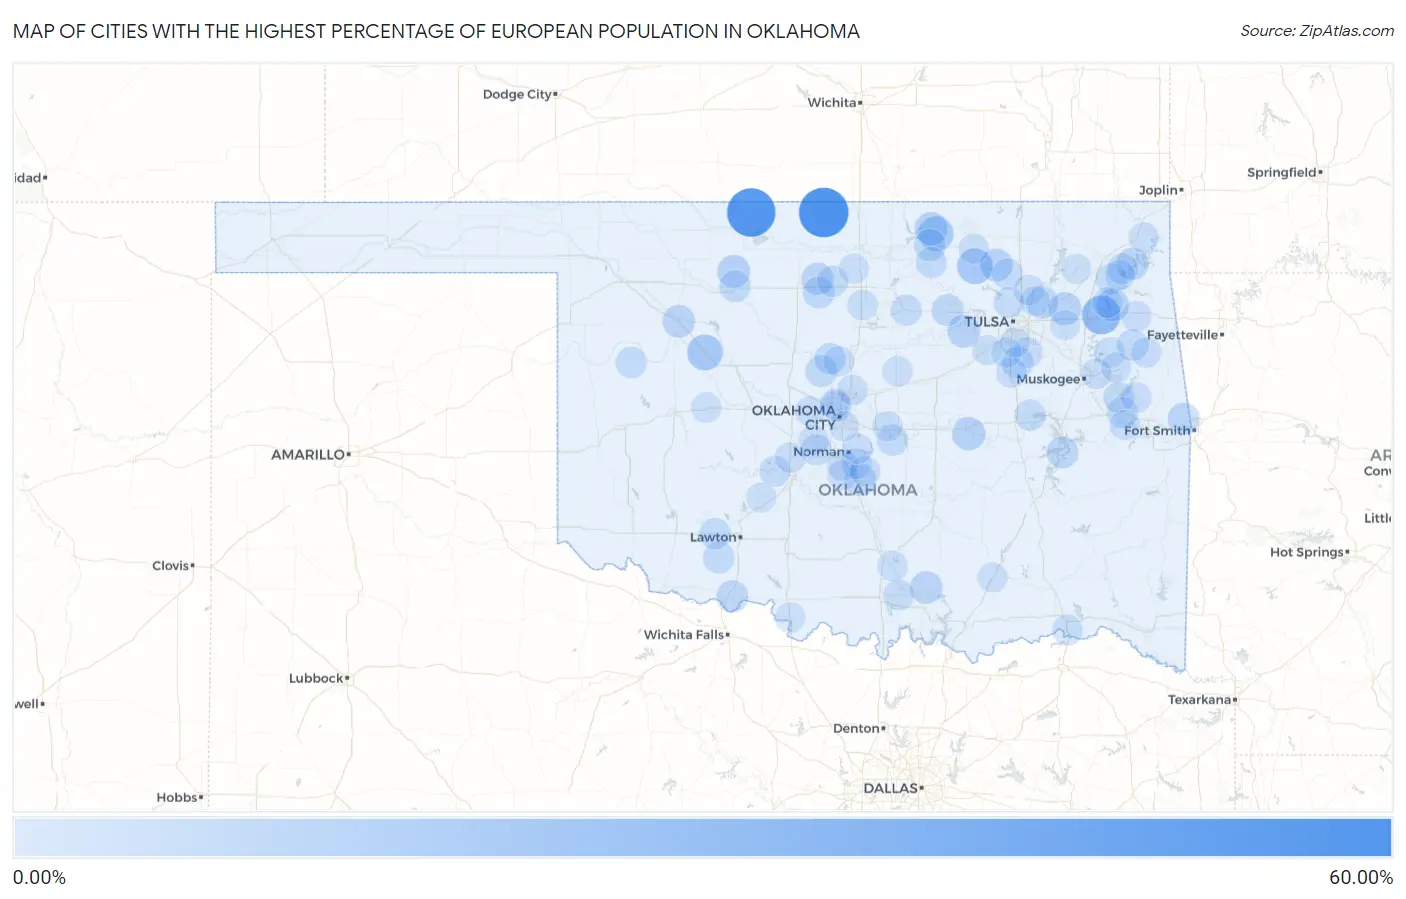
Map of Cities with the Highest Percentage of European Population in Oklahoma
0.00%
60.00%
Cities with the Highest Percentage of European Population in Oklahoma
| City | European | vs State | vs National | |
| 1. | Renfrow | 52.94% | 1.72%(+51.2)#1 | 1.67%(+51.3)#23 |
| 2. | Amorita | 50.00% | 1.72%(+48.3)#2 | 1.67%(+48.3)#34 |
| 3. | Sams Corner | 24.14% | 1.72%(+22.4)#3 | 1.67%(+22.5)#121 |
| 4. | Bache | 23.46% | 1.72%(+21.7)#4 | 1.67%(+21.8)#128 |
| 5. | Oakwood | 16.39% | 1.72%(+14.7)#5 | 1.67%(+14.7)#257 |
| 6. | Wynona | 16.35% | 1.72%(+14.6)#6 | 1.67%(+14.7)#260 |
| 7. | Briartown | 15.52% | 1.72%(+13.8)#7 | 1.67%(+13.8)#291 |
| 8. | Shidler | 14.21% | 1.72%(+12.5)#8 | 1.67%(+12.5)#355 |
| 9. | Lakeside | 11.76% | 1.72%(+10.0)#9 | 1.67%(+10.1)#479 |
| 10. | Bearden | 10.48% | 1.72%(+8.76)#10 | 1.67%(+8.81)#600 |
| 11. | Webb City | 10.42% | 1.72%(+8.70)#11 | 1.67%(+8.74)#611 |
| 12. | Tiawah | 9.43% | 1.72%(+7.71)#12 | 1.67%(+7.76)#727 |
| 13. | Pump Back | 9.42% | 1.72%(+7.70)#13 | 1.67%(+7.75)#732 |
| 14. | Aline | 9.36% | 1.72%(+7.64)#14 | 1.67%(+7.69)#741 |
| 15. | Barnsdall | 9.03% | 1.72%(+7.31)#15 | 1.67%(+7.35)#788 |
| 16. | Lawrence Creek | 8.93% | 1.72%(+7.21)#16 | 1.67%(+7.25)#805 |
| 17. | Bug Tussle | 8.84% | 1.72%(+7.12)#17 | 1.67%(+7.17)#817 |
| 18. | Ravia | 8.81% | 1.72%(+7.09)#18 | 1.67%(+7.14)#826 |
| 19. | Seiling | 8.81% | 1.72%(+7.09)#19 | 1.67%(+7.13)#828 |
| 20. | Nelagoney | 8.20% | 1.72%(+6.48)#20 | 1.67%(+6.52)#935 |
| 21. | Breckenridge | 7.93% | 1.72%(+6.21)#21 | 1.67%(+6.25)#982 |
| 22. | Cleora | 7.69% | 1.72%(+5.97)#22 | 1.67%(+6.02)#1,031 |
| 23. | Avard | 7.69% | 1.72%(+5.97)#23 | 1.67%(+6.02)#1,039 |
| 24. | Shady Grove Cdp Mcintosh County | 7.27% | 1.72%(+5.55)#24 | 1.67%(+5.60)#1,133 |
| 25. | Remy | 7.18% | 1.72%(+5.46)#25 | 1.67%(+5.51)#1,160 |
| 26. | Valley Park | 7.14% | 1.72%(+5.42)#26 | 1.67%(+5.47)#1,176 |
| 27. | Randlett | 7.12% | 1.72%(+5.40)#27 | 1.67%(+5.45)#1,179 |
| 28. | Lexington | 7.02% | 1.72%(+5.30)#28 | 1.67%(+5.35)#1,199 |
| 29. | Carlton Landing | 6.98% | 1.72%(+5.26)#29 | 1.67%(+5.30)#1,210 |
| 30. | Hallett | 6.85% | 1.72%(+5.13)#30 | 1.67%(+5.18)#1,245 |
| 31. | Liberty | 6.57% | 1.72%(+4.85)#31 | 1.67%(+4.89)#1,330 |
| 32. | Burbank | 6.56% | 1.72%(+4.84)#32 | 1.67%(+4.88)#1,332 |
| 33. | Fairmont | 6.45% | 1.72%(+4.73)#33 | 1.67%(+4.78)#1,361 |
| 34. | Cashion | 6.44% | 1.72%(+4.72)#34 | 1.67%(+4.77)#1,364 |
| 35. | Faxon | 6.25% | 1.72%(+4.53)#35 | 1.67%(+4.58)#1,437 |
| 36. | Cleo Springs | 6.11% | 1.72%(+4.39)#36 | 1.67%(+4.44)#1,488 |
| 37. | Steely Hollow | 5.81% | 1.72%(+4.09)#37 | 1.67%(+4.14)#1,609 |
| 38. | Cimarron City | 5.59% | 1.72%(+3.87)#38 | 1.67%(+3.92)#1,727 |
| 39. | Cache | 5.55% | 1.72%(+3.83)#39 | 1.67%(+3.87)#1,751 |
| 40. | Pensacola | 5.45% | 1.72%(+3.73)#40 | 1.67%(+3.78)#1,797 |
| 41. | Leedey | 5.42% | 1.72%(+3.70)#41 | 1.67%(+3.75)#1,814 |
| 42. | Garber | 5.42% | 1.72%(+3.70)#42 | 1.67%(+3.75)#1,818 |
| 43. | Fairfax | 5.38% | 1.72%(+3.66)#43 | 1.67%(+3.70)#1,849 |
| 44. | Carlisle | 5.29% | 1.72%(+3.57)#44 | 1.67%(+3.62)#1,904 |
| 45. | Bethel Acres | 5.28% | 1.72%(+3.56)#45 | 1.67%(+3.61)#1,907 |
| 46. | Hoffman | 5.26% | 1.72%(+3.54)#46 | 1.67%(+3.59)#1,920 |
| 47. | Glencoe | 4.99% | 1.72%(+3.27)#47 | 1.67%(+3.32)#2,088 |
| 48. | Paradise Hill | 4.82% | 1.72%(+3.10)#48 | 1.67%(+3.14)#2,193 |
| 49. | Verden | 4.60% | 1.72%(+2.88)#49 | 1.67%(+2.93)#2,332 |
| 50. | Bridge Creek | 4.55% | 1.72%(+2.83)#50 | 1.67%(+2.87)#2,393 |
| 51. | Ketchum | 4.50% | 1.72%(+2.78)#51 | 1.67%(+2.83)#2,446 |
| 52. | Nichols Hills | 4.44% | 1.72%(+2.72)#52 | 1.67%(+2.76)#2,507 |
| 53. | Whippoorwill | 4.26% | 1.72%(+2.54)#53 | 1.67%(+2.58)#2,677 |
| 54. | Avant | 4.18% | 1.72%(+2.46)#54 | 1.67%(+2.51)#2,752 |
| 55. | Sperry | 4.14% | 1.72%(+2.42)#55 | 1.67%(+2.46)#2,799 |
| 56. | Grant | 4.05% | 1.72%(+2.33)#56 | 1.67%(+2.37)#2,905 |
| 57. | Dickson | 4.01% | 1.72%(+2.29)#57 | 1.67%(+2.34)#2,942 |
| 58. | Goldsby | 3.94% | 1.72%(+2.22)#58 | 1.67%(+2.26)#3,035 |
| 59. | Leach | 3.70% | 1.72%(+1.98)#59 | 1.67%(+2.03)#3,341 |
| 60. | Washington | 3.64% | 1.72%(+1.92)#60 | 1.67%(+1.97)#3,429 |
| 61. | Salina | 3.63% | 1.72%(+1.91)#61 | 1.67%(+1.96)#3,444 |
| 62. | Cedar Valley | 3.60% | 1.72%(+1.88)#62 | 1.67%(+1.93)#3,483 |
| 63. | Evening Shade | 3.59% | 1.72%(+1.87)#63 | 1.67%(+1.92)#3,496 |
| 64. | Perry | 3.54% | 1.72%(+1.82)#64 | 1.67%(+1.86)#3,575 |
| 65. | Bixby | 3.52% | 1.72%(+1.80)#65 | 1.67%(+1.85)#3,593 |
| 66. | Hulbert | 3.51% | 1.72%(+1.79)#66 | 1.67%(+1.83)#3,615 |
| 67. | Collinsville | 3.43% | 1.72%(+1.71)#67 | 1.67%(+1.76)#3,717 |
| 68. | Beggs | 3.37% | 1.72%(+1.65)#68 | 1.67%(+1.70)#3,796 |
| 69. | The Village | 3.35% | 1.72%(+1.63)#69 | 1.67%(+1.68)#3,830 |
| 70. | Fort Gibson | 3.33% | 1.72%(+1.61)#70 | 1.67%(+1.66)#3,866 |
| 71. | Noble | 3.32% | 1.72%(+1.60)#71 | 1.67%(+1.65)#3,887 |
| 72. | Slaughterville | 3.32% | 1.72%(+1.60)#72 | 1.67%(+1.65)#3,889 |
| 73. | Edmond | 3.27% | 1.72%(+1.55)#73 | 1.67%(+1.60)#3,968 |
| 74. | Norman | 3.26% | 1.72%(+1.54)#74 | 1.67%(+1.59)#3,976 |
| 75. | Mcloud | 3.21% | 1.72%(+1.49)#75 | 1.67%(+1.53)#4,071 |
| 76. | Kellyville | 3.13% | 1.72%(+1.41)#76 | 1.67%(+1.46)#4,222 |
| 77. | Pocasset | 3.11% | 1.72%(+1.39)#77 | 1.67%(+1.43)#4,271 |
| 78. | Baker | 3.09% | 1.72%(+1.37)#78 | 1.67%(+1.42)#4,296 |
| 79. | Tamaha | 3.06% | 1.72%(+1.34)#79 | 1.67%(+1.39)#4,350 |
| 80. | Eldon | 3.06% | 1.72%(+1.34)#80 | 1.67%(+1.38)#4,352 |
| 81. | Weatherford | 2.93% | 1.72%(+1.21)#81 | 1.67%(+1.26)#4,605 |
| 82. | Ryan | 2.91% | 1.72%(+1.19)#82 | 1.67%(+1.24)#4,648 |
| 83. | Carney | 2.90% | 1.72%(+1.18)#83 | 1.67%(+1.22)#4,688 |
| 84. | Tuttle | 2.87% | 1.72%(+1.15)#84 | 1.67%(+1.19)#4,769 |
| 85. | Yukon | 2.85% | 1.72%(+1.13)#85 | 1.67%(+1.18)#4,798 |
| 86. | Keefton | 2.84% | 1.72%(+1.12)#86 | 1.67%(+1.17)#4,823 |
| 87. | Fairland | 2.84% | 1.72%(+1.12)#87 | 1.67%(+1.16)#4,831 |
| 88. | Dougherty | 2.83% | 1.72%(+1.11)#88 | 1.67%(+1.16)#4,843 |
| 89. | Billings | 2.81% | 1.72%(+1.09)#89 | 1.67%(+1.13)#4,885 |
| 90. | Pawhuska | 2.79% | 1.72%(+1.07)#90 | 1.67%(+1.12)#4,922 |
| 91. | Woodall | 2.78% | 1.72%(+1.06)#91 | 1.67%(+1.11)#4,938 |
| 92. | Chelsea | 2.77% | 1.72%(+1.05)#92 | 1.67%(+1.09)#4,972 |
| 93. | Kiefer | 2.76% | 1.72%(+1.04)#93 | 1.67%(+1.08)#4,998 |
| 94. | Valley Brook | 2.73% | 1.72%(+1.01)#94 | 1.67%(+1.06)#5,073 |
| 95. | Cyril | 2.66% | 1.72%(+0.945)#95 | 1.67%(+0.991)#5,214 |
| 96. | Inola | 2.66% | 1.72%(+0.941)#96 | 1.67%(+0.987)#5,227 |
| 97. | Langley | 2.63% | 1.72%(+0.907)#97 | 1.67%(+0.953)#5,318 |
| 98. | Tushka | 2.59% | 1.72%(+0.868)#98 | 1.67%(+0.914)#5,424 |
| 99. | Owasso | 2.58% | 1.72%(+0.855)#99 | 1.67%(+0.901)#5,457 |
| 100. | Jenks | 2.56% | 1.72%(+0.843)#100 | 1.67%(+0.888)#5,490 |
Common Questions
What are the Top 10 Cities with the Highest Percentage of European Population in Oklahoma?
Top 10 Cities with the Highest Percentage of European Population in Oklahoma are:
What city has the Highest Percentage of European Population in Oklahoma?
Renfrow has the Highest Percentage of European Population in Oklahoma with 52.94%.
What is the Percentage of European Population in the State of Oklahoma?
Percentage of European Population in Oklahoma is 1.72%.
What is the Percentage of European Population in the United States?
Percentage of European Population in the United States is 1.67%.