Cities with the Highest Percentage of European Population in New Hampshire

RELATED REPORTS & OPTIONS

European
Population
Families and Households
Female Fertility
Female Fertility (Unmarried)
Race (Community Size)
Race (Percentage)
Ancestry (Community Size)
AfghanAfricanAlaska NativeAlaskan AthabascanAlbanianAleutAlsatianAmericanApacheArabArapahoArgentineanArmenianAssyrian / Chaldean / SyriacAustralianAustrianBahamianBangladeshiBarbadianBasqueBelgianBelizeanBermudanBhutaneseBlackfeetBolivianBrazilianBritishBritish West IndianBulgarianBurmeseCajunCambodianCanadianCape VerdeanCarpatho RusynCelticCentral AmericanCentral American IndianCherokeeCheyenneChickasawChileanChineseChippewaChoctawColombianColvilleComancheCosta RicanCreeCreekCroatianCrowCubanCypriotCzechCzechoslovakianDanishDelawareDominicanDutchDutch West IndianEastern EuropeanEcuadorianEgyptianEnglishEstonianEthiopianEuropeanFijianFilipinoFinnishFrenchFrench American IndianFrench CanadianGermanGerman RussianGhanaianGreekGuamanian / ChamorroGuatemalanGuyaneseHaitianHmongHonduranHopiHoumaHungarianIcelanderIndian (Asian)IndonesianInupiatIranianIraqiIrishIroquoisIsraeliItalianJamaicanJapaneseJordanianKenyanKiowaKoreanLaotianLatvianLebaneseLiberianLithuanianLumbeeLuxembourgerMacedonianMalaysianMalteseMarshalleseMenomineeMexicanMexican American IndianMongolianMoroccanNative HawaiianNavajoNepaleseNew ZealanderNicaraguanNigerianNorthern EuropeanNorwegianOkinawanOsageOttawaPaiutePakistaniPalestinianPanamanianParaguayanPennsylvania GermanPeruvianPimaPolishPortuguesePotawatomiPuebloPuerto RicanPuget Sound SalishRomanianRussianSalvadoranSamoanScandinavianScotch-IrishScottishSeminoleSenegaleseSerbianShoshoneSierra LeoneanSiouxSlavicSlovakSloveneSomaliSouth AfricanSouth AmericanSouth American IndianSoviet UnionSpaniardSpanishSpanish AmericanSpanish American IndianSri LankanSubsaharan AfricanSudaneseSwedishSwissSyrianTaiwaneseThaiTlingit-HaidaTohono O'OdhamTonganTrinidadian and TobagonianTsimshianTurkishU.S. Virgin IslanderUgandanUkrainianUruguayanUteVenezuelanVietnameseWelshWest IndianYakamaYaquiYugoslavianYumanYup'ikZimbabwean
Ancestry (Percentage)
AfghanAfricanAlaska NativeAlaskan AthabascanAlbanianAleutAlsatianAmericanApacheArabArapahoArgentineanArmenianAssyrian / Chaldean / SyriacAustralianAustrianBahamianBangladeshiBarbadianBasqueBelgianBelizeanBermudanBhutaneseBlackfeetBolivianBrazilianBritishBritish West IndianBulgarianBurmeseCajunCambodianCanadianCape VerdeanCarpatho RusynCelticCentral AmericanCentral American IndianCherokeeCheyenneChickasawChileanChineseChippewaChoctawColombianColvilleComancheCosta RicanCreeCreekCroatianCrowCubanCypriotCzechCzechoslovakianDanishDelawareDominicanDutchDutch West IndianEastern EuropeanEcuadorianEgyptianEnglishEstonianEthiopianEuropeanFijianFilipinoFinnishFrenchFrench American IndianFrench CanadianGermanGerman RussianGhanaianGreekGuamanian / ChamorroGuatemalanGuyaneseHaitianHmongHonduranHopiHoumaHungarianIcelanderIndian (Asian)IndonesianInupiatIranianIraqiIrishIroquoisIsraeliItalianJamaicanJapaneseJordanianKenyanKiowaKoreanLaotianLatvianLebaneseLiberianLithuanianLumbeeLuxembourgerMacedonianMalaysianMalteseMarshalleseMenomineeMexicanMexican American IndianMongolianMoroccanNative HawaiianNavajoNepaleseNew ZealanderNicaraguanNigerianNorthern EuropeanNorwegianOkinawanOsageOttawaPaiutePakistaniPalestinianPanamanianParaguayanPennsylvania GermanPeruvianPimaPolishPortuguesePotawatomiPuebloPuerto RicanPuget Sound SalishRomanianRussianSalvadoranSamoanScandinavianScotch-IrishScottishSeminoleSenegaleseSerbianShoshoneSierra LeoneanSiouxSlavicSlovakSloveneSomaliSouth AfricanSouth AmericanSouth American IndianSoviet UnionSpaniardSpanishSpanish AmericanSpanish American IndianSri LankanSubsaharan AfricanSudaneseSwedishSwissSyrianTaiwaneseThaiTlingit-HaidaTohono O'OdhamTonganTrinidadian and TobagonianTsimshianTurkishU.S. Virgin IslanderUgandanUkrainianUruguayanUteVenezuelanVietnameseWelshWest IndianYakamaYaquiYugoslavianYumanYup'ikZimbabwean
Immigrant Origin (Total)
AfghanistanAfricaAlbaniaArgentinaArmeniaAsiaAustraliaAustriaAzoresBahamasBangladeshBarbadosBelarusBelgiumBelizeBoliviaBosnia and HerzegovinaBrazilBulgariaBurma / MyanmarCabo VerdeCambodiaCameroonCanadaCaribbeanCentral AmericaChileChinaColombiaCongoCosta RicaCroatiaCubaCzechoslovakiaDenmarkDominicaDominican RepublicEastern AfricaEastern AsiaEastern EuropeEcuadorEgyptEl SalvadorEnglandEritreaEthiopiaEuropeFijiFranceGermanyGhanaGreeceGrenadaGuatemalaGuyanaHaitiHondurasHong KongHungaryIndiaIndonesiaIranIraqIrelandIsraelItalyJamaicaJapanJordanKazakhstanKenyaKoreaKuwaitLaosLatin AmericaLatviaLebanonLiberiaLithuaniaMalaysiaMexicoMicronesiaMiddle AfricaMoldovaMoroccoNepalNetherlandsNicaraguaNigeriaNorth MacedoniaNorthern AfricaNorthern EuropeNorwayOceaniaPakistanPanamaPeruPhilippinesPolandPortugalRomaniaRussiaSaudi ArabiaScotlandSenegalSerbiaSierra LeoneSingaporeSomaliaSouth AfricaSouth AmericaSouth Central AsiaSouth Eastern AsiaSouthern EuropeSpainSri LankaSt. Vincent and the GrenadinesSudanSwedenSwitzerlandSyriaTaiwanThailandTrinidad and TobagoTurkeyUgandaUkraineUruguayUzbekistanVenezuelaVietnamWest IndiesWestern AfricaWestern AsiaWestern EuropeYemenZaireZimbabwe
Immigrant Origin (Percentage)
AfghanistanAfricaAlbaniaArgentinaArmeniaAsiaAustraliaAustriaAzoresBahamasBangladeshBarbadosBelarusBelgiumBelizeBoliviaBosnia and HerzegovinaBrazilBulgariaBurma / MyanmarCabo VerdeCambodiaCameroonCanadaCaribbeanCentral AmericaChileChinaColombiaCongoCosta RicaCroatiaCubaCzechoslovakiaDenmarkDominicaDominican RepublicEastern AfricaEastern AsiaEastern EuropeEcuadorEgyptEl SalvadorEnglandEritreaEthiopiaEuropeFijiFranceGermanyGhanaGreeceGrenadaGuatemalaGuyanaHaitiHondurasHong KongHungaryIndiaIndonesiaIranIraqIrelandIsraelItalyJamaicaJapanJordanKazakhstanKenyaKoreaKuwaitLaosLatin AmericaLatviaLebanonLiberiaLithuaniaMalaysiaMexicoMicronesiaMiddle AfricaMoldovaMoroccoNepalNetherlandsNicaraguaNigeriaNorth MacedoniaNorthern AfricaNorthern EuropeNorwayOceaniaPakistanPanamaPeruPhilippinesPolandPortugalRomaniaRussiaSaudi ArabiaScotlandSenegalSerbiaSierra LeoneSingaporeSomaliaSouth AfricaSouth AmericaSouth Central AsiaSouth Eastern AsiaSouthern EuropeSpainSri LankaSt. Vincent and the GrenadinesSudanSwedenSwitzerlandSyriaTaiwanThailandTrinidad and TobagoTurkeyUgandaUkraineUruguayUzbekistanVenezuelaVietnamWest IndiesWestern AfricaWestern AsiaWestern EuropeYemenZaireZimbabwe
Income
Income (Families)
Income (Households)
Poverty
Poverty (Families)
Unemployment
Employment Occupations
Employment Industries
Employer Class
Commute Time
Commute Means
School Enrollment
Education by Degree Field
Occupancy
Finances
Physical Characteristics
New Hampshire
Compare Cities
Comparison Subject

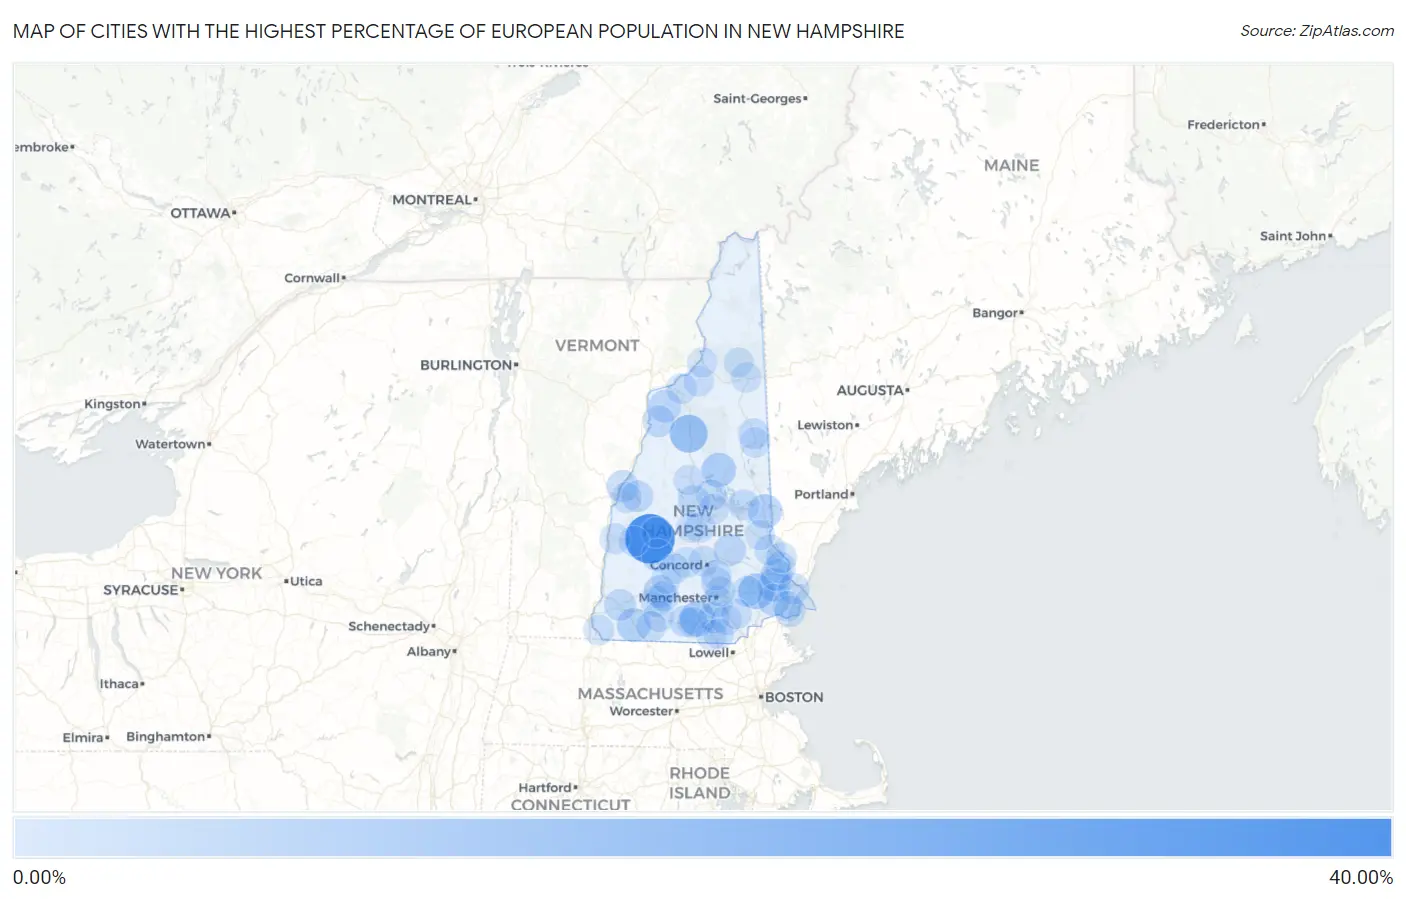
Map of Cities with the Highest Percentage of European Population in New Hampshire

0.00%
40.00%
Cities with the Highest Percentage of European Population in New Hampshire Map

Cities with the Highest Percentage of European Population in New Hampshire

City European vs State vs National
1.Blodgett Landing30.10%1.39%(+28.7)#11.67%(+28.4)#82
2.North Woodstock11.65%1.39%(+10.3)#21.67%(+9.98)#485
3.Epping8.50%1.39%(+7.11)#31.67%(+6.82)#876
4.Amherst7.92%1.39%(+6.53)#41.67%(+6.24)#985
5.Center Sandwich6.40%1.39%(+5.01)#51.67%(+4.72)#1,379
6.Sanbornville5.98%1.39%(+4.60)#61.67%(+4.31)#1,534
7.Troy5.43%1.39%(+4.05)#71.67%(+3.76)#1,810
8.Newmarket4.48%1.39%(+3.09)#81.67%(+2.80)#2,468
9.Lisbon3.44%1.39%(+2.05)#91.67%(+1.77)#3,705
10.Bradford3.36%1.39%(+1.97)#101.67%(+1.68)#3,823
11.Pittsfield3.20%1.39%(+1.81)#111.67%(+1.52)#4,102
12.Antrim3.03%1.39%(+1.64)#121.67%(+1.36)#4,402
13.Hanover3.01%1.39%(+1.62)#131.67%(+1.34)#4,443
14.Exeter2.91%1.39%(+1.53)#141.67%(+1.24)#4,643
15.New Hampton2.78%1.39%(+1.39)#151.67%(+1.10)#4,948
16.Keene2.72%1.39%(+1.33)#161.67%(+1.05)#5,096
17.Mountain Lakes2.51%1.39%(+1.12)#171.67%(+0.838)#5,626
18.Durham2.37%1.39%(+0.985)#181.67%(+0.698)#6,064
19.Enfield2.31%1.39%(+0.921)#191.67%(+0.635)#6,269
20.Portsmouth1.94%1.39%(+0.554)#201.67%(+0.268)#7,574
21.Dover1.93%1.39%(+0.539)#211.67%(+0.253)#7,639
22.Wilton1.88%1.39%(+0.487)#221.67%(+0.201)#7,835
23.East Merrimack1.62%1.39%(+0.227)#231.67%(-0.059)#9,010
24.Hancock1.51%1.39%(+0.120)#241.67%(-0.167)#9,526
25.Hampton Beach1.43%1.39%(+0.046)#251.67%(-0.240)#9,887
26.Meredith1.41%1.39%(+0.026)#261.67%(-0.260)#10,009
27.Wolfeboro1.35%1.39%(-0.037)#271.67%(-0.323)#10,373
28.Rochester1.34%1.39%(-0.049)#281.67%(-0.336)#10,443
29.Raymond1.32%1.39%(-0.065)#291.67%(-0.351)#10,530
30.North Conway1.30%1.39%(-0.089)#301.67%(-0.376)#10,659
31.Lebanon1.21%1.39%(-0.182)#311.67%(-0.469)#11,192
32.Tilton Northfield1.15%1.39%(-0.235)#321.67%(-0.521)#11,493
33.Nashua1.15%1.39%(-0.236)#331.67%(-0.522)#11,501
34.Somersworth1.12%1.39%(-0.271)#341.67%(-0.557)#11,709
35.Manchester1.09%1.39%(-0.294)#351.67%(-0.581)#11,838
36.Milford1.02%1.39%(-0.368)#361.67%(-0.654)#12,274
37.Contoocook1.00%1.39%(-0.384)#371.67%(-0.670)#12,382
38.Littleton0.94%1.39%(-0.451)#381.67%(-0.737)#12,829
39.Hooksett0.93%1.39%(-0.458)#391.67%(-0.744)#12,884
40.Hinsdale0.91%1.39%(-0.480)#401.67%(-0.766)#13,024
41.Claremont0.87%1.39%(-0.520)#411.67%(-0.806)#13,268
42.Concord0.83%1.39%(-0.555)#421.67%(-0.841)#13,502
43.Peterborough0.80%1.39%(-0.587)#431.67%(-0.873)#13,732
44.Bennington0.79%1.39%(-0.597)#441.67%(-0.884)#13,812
45.Gorham0.78%1.39%(-0.605)#451.67%(-0.891)#13,879
46.Plymouth0.72%1.39%(-0.665)#461.67%(-0.952)#14,306
47.Londonderry0.72%1.39%(-0.672)#471.67%(-0.958)#14,353
48.Whitefield0.68%1.39%(-0.712)#481.67%(-0.999)#14,682
49.Derry0.65%1.39%(-0.737)#491.67%(-1.02)#14,881
50.Laconia0.63%1.39%(-0.761)#501.67%(-1.05)#15,051
51.Suncook0.59%1.39%(-0.796)#511.67%(-1.08)#15,301
52.Hampton0.56%1.39%(-0.831)#521.67%(-1.12)#15,566
53.New London0.52%1.39%(-0.866)#531.67%(-1.15)#15,814
54.Conway0.52%1.39%(-0.868)#541.67%(-1.15)#15,837
55.Newport0.48%1.39%(-0.910)#551.67%(-1.20)#16,171
56.Franklin0.47%1.39%(-0.919)#561.67%(-1.21)#16,252
57.Lancaster0.44%1.39%(-0.946)#571.67%(-1.23)#16,447
58.Farmington0.40%1.39%(-0.985)#581.67%(-1.27)#16,734
59.Jaffrey0.40%1.39%(-0.993)#591.67%(-1.28)#16,799
60.Hudson0.34%1.39%(-1.05)#601.67%(-1.33)#17,180
61.South Hooksett0.22%1.39%(-1.16)#611.67%(-1.45)#18,074
62.Berlin0.084%1.39%(-1.30)#621.67%(-1.59)#18,770
63.Hillsborough0.064%1.39%(-1.32)#631.67%(-1.61)#18,851
64.Henniker0.036%1.39%(-1.35)#641.67%(-1.64)#18,897

Common Questions

What are the Top 10 Cities with the Highest Percentage of European Population in New Hampshire?
Top 10 Cities with the Highest Percentage of European Population in New Hampshire are:
#1
30.10%
#2
11.65%
#3
8.50%
#4
7.92%
#5
6.40%
#6
5.98%
#7
5.43%
#8
4.48%
#9
3.44%
#10
3.36%
What city has the Highest Percentage of European Population in New Hampshire?
Blodgett Landing has the Highest Percentage of European Population in New Hampshire with 30.10%.
What is the Percentage of European Population in the State of New Hampshire?
Percentage of European Population in New Hampshire is 1.39%.
What is the Percentage of European Population in the United States?
Percentage of European Population in the United States is 1.67%.