Cities with the Highest Percentage of European Population in Delaware

RELATED REPORTS & OPTIONS

European
Population
Families and Households
Female Fertility
Female Fertility (Unmarried)
Race (Community Size)
Race (Percentage)
Ancestry (Community Size)
AfghanAfricanAlaska NativeAlaskan AthabascanAlbanianAleutAlsatianAmericanApacheArabArapahoArgentineanArmenianAssyrian / Chaldean / SyriacAustralianAustrianBahamianBangladeshiBarbadianBasqueBelgianBelizeanBermudanBhutaneseBlackfeetBolivianBrazilianBritishBritish West IndianBulgarianBurmeseCajunCambodianCanadianCape VerdeanCarpatho RusynCelticCentral AmericanCentral American IndianCherokeeCheyenneChickasawChileanChineseChippewaChoctawColombianColvilleComancheCosta RicanCreeCreekCroatianCrowCubanCypriotCzechCzechoslovakianDanishDelawareDominicanDutchDutch West IndianEastern EuropeanEcuadorianEgyptianEnglishEstonianEthiopianEuropeanFijianFilipinoFinnishFrenchFrench American IndianFrench CanadianGermanGerman RussianGhanaianGreekGuamanian / ChamorroGuatemalanGuyaneseHaitianHmongHonduranHopiHoumaHungarianIcelanderIndian (Asian)IndonesianInupiatIranianIraqiIrishIroquoisIsraeliItalianJamaicanJapaneseJordanianKenyanKiowaKoreanLaotianLatvianLebaneseLiberianLithuanianLumbeeLuxembourgerMacedonianMalaysianMalteseMarshalleseMenomineeMexicanMexican American IndianMongolianMoroccanNative HawaiianNavajoNepaleseNew ZealanderNicaraguanNigerianNorthern EuropeanNorwegianOkinawanOsageOttawaPaiutePakistaniPalestinianPanamanianParaguayanPennsylvania GermanPeruvianPimaPolishPortuguesePotawatomiPuebloPuerto RicanPuget Sound SalishRomanianRussianSalvadoranSamoanScandinavianScotch-IrishScottishSeminoleSenegaleseSerbianShoshoneSierra LeoneanSiouxSlavicSlovakSloveneSomaliSouth AfricanSouth AmericanSouth American IndianSoviet UnionSpaniardSpanishSpanish AmericanSpanish American IndianSri LankanSubsaharan AfricanSudaneseSwedishSwissSyrianTaiwaneseThaiTlingit-HaidaTohono O'OdhamTonganTrinidadian and TobagonianTsimshianTurkishU.S. Virgin IslanderUgandanUkrainianUruguayanUteVenezuelanVietnameseWelshWest IndianYakamaYaquiYugoslavianYumanYup'ikZimbabwean
Ancestry (Percentage)
AfghanAfricanAlaska NativeAlaskan AthabascanAlbanianAleutAlsatianAmericanApacheArabArapahoArgentineanArmenianAssyrian / Chaldean / SyriacAustralianAustrianBahamianBangladeshiBarbadianBasqueBelgianBelizeanBermudanBhutaneseBlackfeetBolivianBrazilianBritishBritish West IndianBulgarianBurmeseCajunCambodianCanadianCape VerdeanCarpatho RusynCelticCentral AmericanCentral American IndianCherokeeCheyenneChickasawChileanChineseChippewaChoctawColombianColvilleComancheCosta RicanCreeCreekCroatianCrowCubanCypriotCzechCzechoslovakianDanishDelawareDominicanDutchDutch West IndianEastern EuropeanEcuadorianEgyptianEnglishEstonianEthiopianEuropeanFijianFilipinoFinnishFrenchFrench American IndianFrench CanadianGermanGerman RussianGhanaianGreekGuamanian / ChamorroGuatemalanGuyaneseHaitianHmongHonduranHopiHoumaHungarianIcelanderIndian (Asian)IndonesianInupiatIranianIraqiIrishIroquoisIsraeliItalianJamaicanJapaneseJordanianKenyanKiowaKoreanLaotianLatvianLebaneseLiberianLithuanianLumbeeLuxembourgerMacedonianMalaysianMalteseMarshalleseMenomineeMexicanMexican American IndianMongolianMoroccanNative HawaiianNavajoNepaleseNew ZealanderNicaraguanNigerianNorthern EuropeanNorwegianOkinawanOsageOttawaPaiutePakistaniPalestinianPanamanianParaguayanPennsylvania GermanPeruvianPimaPolishPortuguesePotawatomiPuebloPuerto RicanPuget Sound SalishRomanianRussianSalvadoranSamoanScandinavianScotch-IrishScottishSeminoleSenegaleseSerbianShoshoneSierra LeoneanSiouxSlavicSlovakSloveneSomaliSouth AfricanSouth AmericanSouth American IndianSoviet UnionSpaniardSpanishSpanish AmericanSpanish American IndianSri LankanSubsaharan AfricanSudaneseSwedishSwissSyrianTaiwaneseThaiTlingit-HaidaTohono O'OdhamTonganTrinidadian and TobagonianTsimshianTurkishU.S. Virgin IslanderUgandanUkrainianUruguayanUteVenezuelanVietnameseWelshWest IndianYakamaYaquiYugoslavianYumanYup'ikZimbabwean
Immigrant Origin (Total)
AfghanistanAfricaAlbaniaArgentinaArmeniaAsiaAustraliaAustriaAzoresBahamasBangladeshBarbadosBelarusBelgiumBelizeBoliviaBosnia and HerzegovinaBrazilBulgariaBurma / MyanmarCabo VerdeCambodiaCameroonCanadaCaribbeanCentral AmericaChileChinaColombiaCongoCosta RicaCroatiaCubaCzechoslovakiaDenmarkDominicaDominican RepublicEastern AfricaEastern AsiaEastern EuropeEcuadorEgyptEl SalvadorEnglandEritreaEthiopiaEuropeFijiFranceGermanyGhanaGreeceGrenadaGuatemalaGuyanaHaitiHondurasHong KongHungaryIndiaIndonesiaIranIraqIrelandIsraelItalyJamaicaJapanJordanKazakhstanKenyaKoreaKuwaitLaosLatin AmericaLatviaLebanonLiberiaLithuaniaMalaysiaMexicoMicronesiaMiddle AfricaMoldovaMoroccoNepalNetherlandsNicaraguaNigeriaNorth MacedoniaNorthern AfricaNorthern EuropeNorwayOceaniaPakistanPanamaPeruPhilippinesPolandPortugalRomaniaRussiaSaudi ArabiaScotlandSenegalSerbiaSierra LeoneSingaporeSomaliaSouth AfricaSouth AmericaSouth Central AsiaSouth Eastern AsiaSouthern EuropeSpainSri LankaSt. Vincent and the GrenadinesSudanSwedenSwitzerlandSyriaTaiwanThailandTrinidad and TobagoTurkeyUgandaUkraineUruguayUzbekistanVenezuelaVietnamWest IndiesWestern AfricaWestern AsiaWestern EuropeYemenZaireZimbabwe
Immigrant Origin (Percentage)
AfghanistanAfricaAlbaniaArgentinaArmeniaAsiaAustraliaAustriaAzoresBahamasBangladeshBarbadosBelarusBelgiumBelizeBoliviaBosnia and HerzegovinaBrazilBulgariaBurma / MyanmarCabo VerdeCambodiaCameroonCanadaCaribbeanCentral AmericaChileChinaColombiaCongoCosta RicaCroatiaCubaCzechoslovakiaDenmarkDominicaDominican RepublicEastern AfricaEastern AsiaEastern EuropeEcuadorEgyptEl SalvadorEnglandEritreaEthiopiaEuropeFijiFranceGermanyGhanaGreeceGrenadaGuatemalaGuyanaHaitiHondurasHong KongHungaryIndiaIndonesiaIranIraqIrelandIsraelItalyJamaicaJapanJordanKazakhstanKenyaKoreaKuwaitLaosLatin AmericaLatviaLebanonLiberiaLithuaniaMalaysiaMexicoMicronesiaMiddle AfricaMoldovaMoroccoNepalNetherlandsNicaraguaNigeriaNorth MacedoniaNorthern AfricaNorthern EuropeNorwayOceaniaPakistanPanamaPeruPhilippinesPolandPortugalRomaniaRussiaSaudi ArabiaScotlandSenegalSerbiaSierra LeoneSingaporeSomaliaSouth AfricaSouth AmericaSouth Central AsiaSouth Eastern AsiaSouthern EuropeSpainSri LankaSt. Vincent and the GrenadinesSudanSwedenSwitzerlandSyriaTaiwanThailandTrinidad and TobagoTurkeyUgandaUkraineUruguayUzbekistanVenezuelaVietnamWest IndiesWestern AfricaWestern AsiaWestern EuropeYemenZaireZimbabwe
Income
Income (Families)
Income (Households)
Poverty
Poverty (Families)
Unemployment
Employment Occupations
Employment Industries
Employer Class
Commute Time
Commute Means
School Enrollment
Education by Degree Field
Occupancy
Finances
Physical Characteristics
Delaware
Compare Cities
Comparison Subject

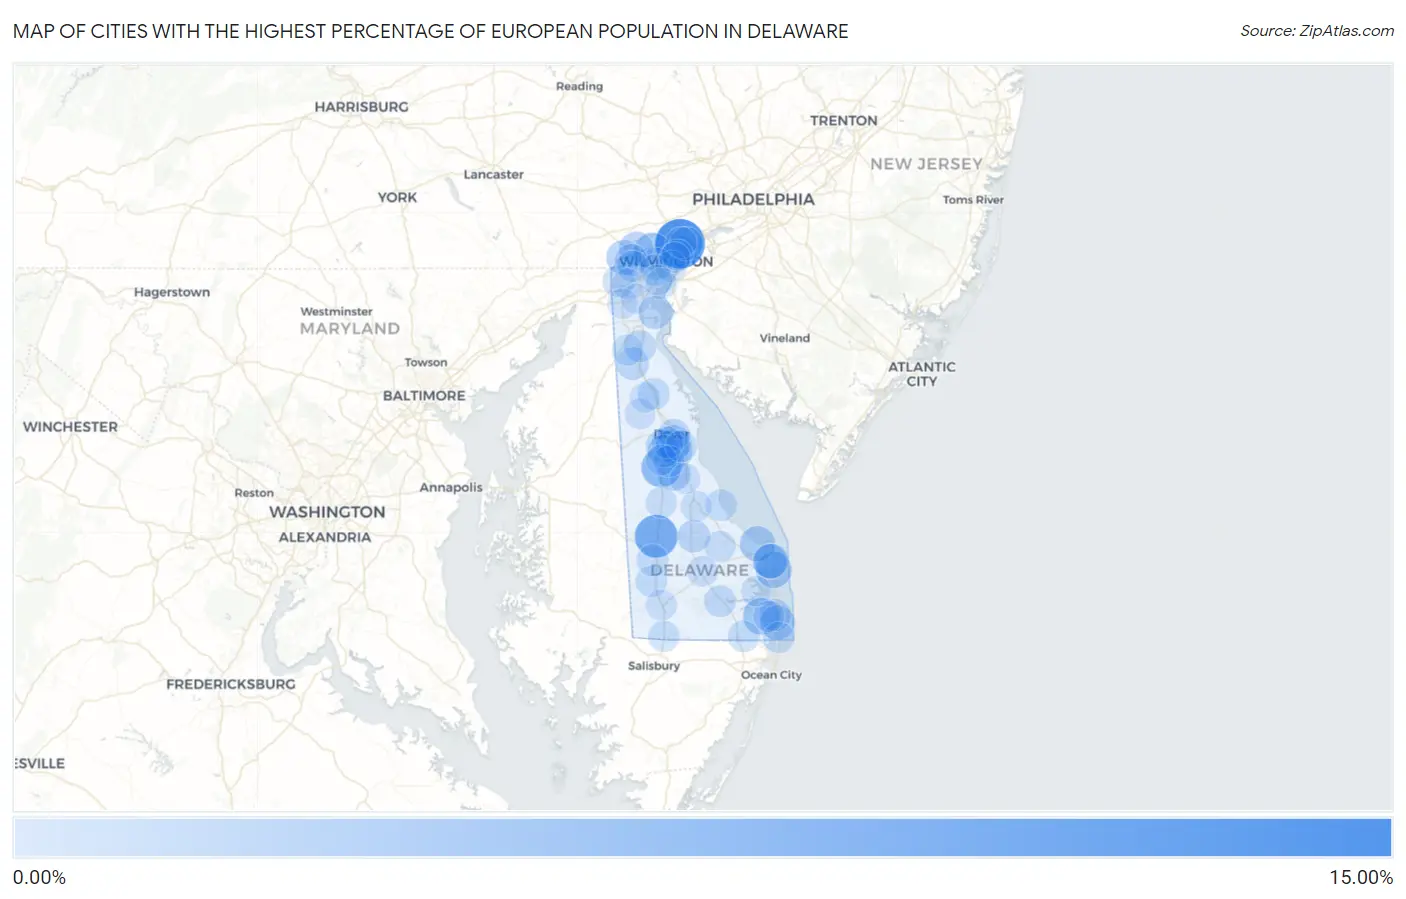
Map of Cities with the Highest Percentage of European Population in Delaware

0.00%
15.00%
Cities with the Highest Percentage of European Population in Delaware Map

Cities with the Highest Percentage of European Population in Delaware

City European vs State vs National
1.Ardencroft10.53%1.09%(+9.43)#11.67%(+8.85)#593
2.Greenwood6.81%1.09%(+5.72)#21.67%(+5.14)#1,262
3.Viola4.94%1.09%(+3.85)#31.67%(+3.26)#2,119
4.Greenville3.58%1.09%(+2.48)#41.67%(+1.90)#3,514
5.Millville3.36%1.09%(+2.27)#51.67%(+1.69)#3,813
6.Dewey Beach3.06%1.09%(+1.97)#61.67%(+1.39)#4,349
7.Lewes2.70%1.09%(+1.60)#71.67%(+1.02)#5,145
8.Lincoln2.64%1.09%(+1.55)#81.67%(+0.966)#5,277
9.Henlopen Acres2.59%1.09%(+1.50)#91.67%(+0.916)#5,415
10.South Bethany2.45%1.09%(+1.36)#101.67%(+0.775)#5,824
11.North Star2.35%1.09%(+1.26)#111.67%(+0.679)#6,116
12.Kent Acres2.31%1.09%(+1.22)#121.67%(+0.633)#6,279
13.Rehoboth Beach2.21%1.09%(+1.12)#131.67%(+0.536)#6,600
14.Hockessin2.08%1.09%(+0.991)#141.67%(+0.408)#7,066
15.Riverview1.85%1.09%(+0.759)#151.67%(+0.176)#7,940
16.Claymont1.77%1.09%(+0.675)#161.67%(+0.092)#8,318
17.Highland Acres1.70%1.09%(+0.604)#171.67%(+0.021)#8,624
18.Delaware City1.66%1.09%(+0.565)#181.67%(-0.018)#8,809
19.Wyoming1.59%1.09%(+0.497)#191.67%(-0.085)#9,136
20.Rising Sun Lebanon1.43%1.09%(+0.337)#201.67%(-0.246)#9,925
21.Ellendale1.31%1.09%(+0.222)#211.67%(-0.361)#10,588
22.Townsend1.21%1.09%(+0.118)#221.67%(-0.465)#11,165
23.Camden1.20%1.09%(+0.109)#231.67%(-0.473)#11,220
24.Elsmere1.19%1.09%(+0.103)#241.67%(-0.480)#11,261
25.Bethany Beach1.13%1.09%(+0.036)#251.67%(-0.546)#11,644
26.Pike Creek1.09%1.09%(-0.002)#261.67%(-0.585)#11,863
27.Dover1.04%1.09%(-0.055)#271.67%(-0.638)#12,183
28.Odessa1.03%1.09%(-0.063)#281.67%(-0.646)#12,231
29.Newark0.99%1.09%(-0.100)#291.67%(-0.683)#12,468
30.Rodney Village0.92%1.09%(-0.171)#301.67%(-0.754)#12,946
31.Millsboro0.87%1.09%(-0.219)#311.67%(-0.802)#13,235
32.Smyrna0.85%1.09%(-0.237)#321.67%(-0.820)#13,349
33.Woodside East0.80%1.09%(-0.292)#331.67%(-0.875)#13,749
34.Bridgeville0.77%1.09%(-0.319)#341.67%(-0.902)#13,967
35.Dover Base Housing0.77%1.09%(-0.325)#351.67%(-0.908)#14,006
36.Slaughter Beach0.76%1.09%(-0.328)#361.67%(-0.911)#14,030
37.Selbyville0.72%1.09%(-0.369)#371.67%(-0.952)#14,310
38.Seaford0.71%1.09%(-0.384)#381.67%(-0.967)#14,425
39.Newport0.70%1.09%(-0.393)#391.67%(-0.976)#14,502
40.Wilmington0.62%1.09%(-0.476)#401.67%(-1.06)#15,135
41.Middletown0.61%1.09%(-0.481)#411.67%(-1.06)#15,174
42.Fenwick Island0.57%1.09%(-0.520)#421.67%(-1.10)#15,457
43.Pike Creek Valley0.57%1.09%(-0.524)#431.67%(-1.11)#15,493
44.New Castle0.56%1.09%(-0.530)#441.67%(-1.11)#15,542
45.Delmar0.54%1.09%(-0.549)#451.67%(-1.13)#15,694
46.Harrington0.50%1.09%(-0.588)#461.67%(-1.17)#15,949
47.Milford0.50%1.09%(-0.588)#471.67%(-1.17)#15,951
48.Ocean View0.49%1.09%(-0.603)#481.67%(-1.19)#16,086
49.Milton0.48%1.09%(-0.614)#491.67%(-1.20)#16,174
50.Ardentown0.45%1.09%(-0.643)#501.67%(-1.23)#16,411
51.Woodside0.40%1.09%(-0.696)#511.67%(-1.28)#16,804
52.Bellefonte0.39%1.09%(-0.698)#521.67%(-1.28)#16,816
53.Laurel0.38%1.09%(-0.712)#531.67%(-1.29)#16,920
54.Brookside0.30%1.09%(-0.791)#541.67%(-1.37)#17,502
55.Georgetown0.29%1.09%(-0.802)#551.67%(-1.38)#17,596
56.Kenton0.25%1.09%(-0.842)#561.67%(-1.42)#17,896
57.Frederica0.20%1.09%(-0.892)#571.67%(-1.47)#18,256
58.Edgemoor0.19%1.09%(-0.907)#581.67%(-1.49)#18,332
59.Clayton0.15%1.09%(-0.941)#591.67%(-1.52)#18,499
60.Long Neck0.13%1.09%(-0.957)#601.67%(-1.54)#18,582
61.Glasgow0.11%1.09%(-0.981)#611.67%(-1.56)#18,663
62.Wilmington Manor0.11%1.09%(-0.983)#621.67%(-1.57)#18,674
63.Bear0.074%1.09%(-1.02)#631.67%(-1.60)#18,813

Common Questions

What are the Top 10 Cities with the Highest Percentage of European Population in Delaware?
Top 10 Cities with the Highest Percentage of European Population in Delaware are:
#1
10.53%
#2
6.81%
#3
4.94%
#4
3.58%
#5
3.36%
#6
3.06%
#7
2.70%
#8
2.59%
#9
2.45%
#10
2.35%
What city has the Highest Percentage of European Population in Delaware?
Ardencroft has the Highest Percentage of European Population in Delaware with 10.53%.
What is the Percentage of European Population in the State of Delaware?
Percentage of European Population in Delaware is 1.09%.
What is the Percentage of European Population in the United States?
Percentage of European Population in the United States is 1.67%.