Cities with the Highest Percentage of European Population in Oregon
RELATED REPORTS & OPTIONS
European
Oregon
Compare Cities
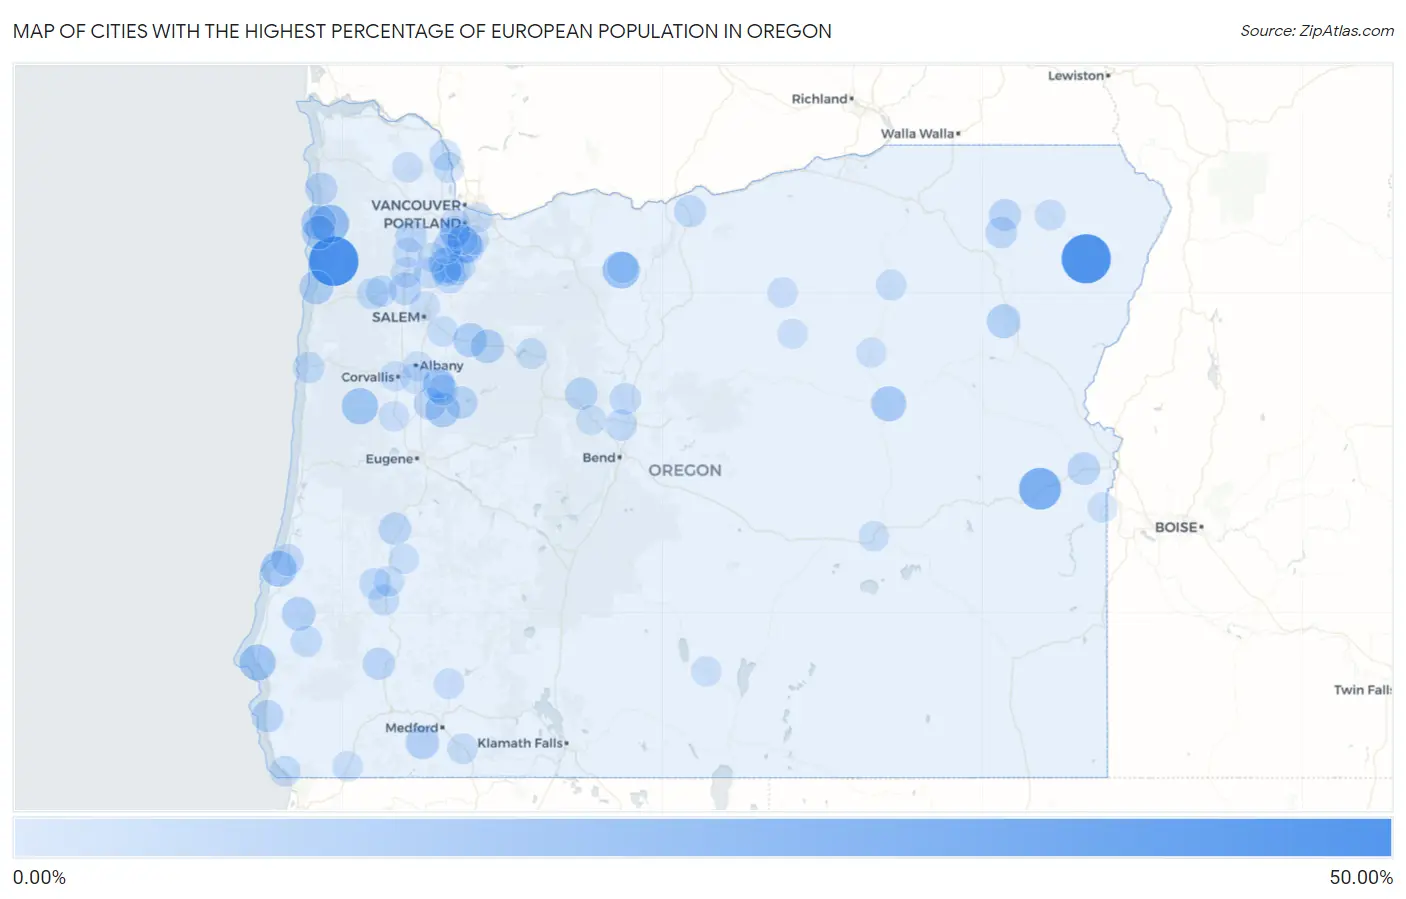
Map of Cities with the Highest Percentage of European Population in Oregon
0.00%
50.00%
Cities with the Highest Percentage of European Population in Oregon
| City | European | vs State | vs National | |
| 1. | Beaver | 40.29% | 3.82%(+36.5)#1 | 1.67%(+38.6)#49 |
| 2. | Wallowa Lake | 39.58% | 3.82%(+35.8)#2 | 1.67%(+37.9)#53 |
| 3. | Harper | 26.09% | 3.82%(+22.3)#3 | 1.67%(+24.4)#107 |
| 4. | Idaville | 19.16% | 3.82%(+15.3)#4 | 1.67%(+17.5)#200 |
| 5. | Wamic | 17.31% | 3.82%(+13.5)#5 | 1.67%(+15.6)#237 |
| 6. | Elmira | 15.93% | 3.82%(+12.1)#6 | 1.67%(+14.3)#275 |
| 7. | Stafford | 15.89% | 3.82%(+12.1)#7 | 1.67%(+14.2)#279 |
| 8. | Alsea | 15.83% | 3.82%(+12.0)#8 | 1.67%(+14.2)#284 |
| 9. | Port Orford | 15.50% | 3.82%(+11.7)#9 | 1.67%(+13.8)#293 |
| 10. | Dexter | 15.45% | 3.82%(+11.6)#10 | 1.67%(+13.8)#295 |
| 11. | Cheshire | 15.41% | 3.82%(+11.6)#11 | 1.67%(+13.7)#296 |
| 12. | Barview | 15.24% | 3.82%(+11.4)#12 | 1.67%(+13.6)#305 |
| 13. | Green Meadows | 15.18% | 3.82%(+11.4)#13 | 1.67%(+13.5)#309 |
| 14. | Butteville | 13.68% | 3.82%(+9.86)#14 | 1.67%(+12.0)#375 |
| 15. | Canyon City | 13.55% | 3.82%(+9.73)#15 | 1.67%(+11.9)#380 |
| 16. | Mapleton | 13.14% | 3.82%(+9.32)#16 | 1.67%(+11.5)#392 |
| 17. | Cape Meares | 13.07% | 3.82%(+9.24)#17 | 1.67%(+11.4)#397 |
| 18. | Crawfordsville | 12.76% | 3.82%(+8.94)#18 | 1.67%(+11.1)#413 |
| 19. | Mehama | 11.61% | 3.82%(+7.79)#19 | 1.67%(+9.94)#489 |
| 20. | Haines | 11.36% | 3.82%(+7.54)#20 | 1.67%(+9.69)#512 |
| 21. | Neskowin | 11.30% | 3.82%(+7.48)#21 | 1.67%(+9.63)#519 |
| 22. | Oceanside | 11.23% | 3.82%(+7.41)#22 | 1.67%(+9.55)#530 |
| 23. | Myrtle Point | 11.04% | 3.82%(+7.22)#23 | 1.67%(+9.37)#543 |
| 24. | Mill City | 10.91% | 3.82%(+7.09)#24 | 1.67%(+9.23)#549 |
| 25. | Ruch | 10.89% | 3.82%(+7.07)#25 | 1.67%(+9.22)#553 |
| 26. | South Lebanon | 9.78% | 3.82%(+5.95)#26 | 1.67%(+8.10)#684 |
| 27. | Vale | 9.43% | 3.82%(+5.60)#27 | 1.67%(+7.75)#730 |
| 28. | Amity | 9.41% | 3.82%(+5.59)#28 | 1.67%(+7.74)#733 |
| 29. | Yoncalla | 9.33% | 3.82%(+5.51)#29 | 1.67%(+7.66)#747 |
| 30. | Sweet Home | 9.07% | 3.82%(+5.25)#30 | 1.67%(+7.40)#779 |
| 31. | Camp Sherman | 8.95% | 3.82%(+5.12)#31 | 1.67%(+7.27)#801 |
| 32. | Neahkahnie | 8.94% | 3.82%(+5.12)#32 | 1.67%(+7.27)#802 |
| 33. | Glendale | 8.83% | 3.82%(+5.00)#33 | 1.67%(+7.15)#821 |
| 34. | Brownsville | 8.68% | 3.82%(+4.86)#34 | 1.67%(+7.00)#850 |
| 35. | Gold Beach | 8.53% | 3.82%(+4.70)#35 | 1.67%(+6.85)#867 |
| 36. | Elgin | 8.48% | 3.82%(+4.66)#36 | 1.67%(+6.81)#881 |
| 37. | Gaston | 8.43% | 3.82%(+4.60)#37 | 1.67%(+6.75)#890 |
| 38. | Wasco | 8.09% | 3.82%(+4.27)#38 | 1.67%(+6.42)#957 |
| 39. | North Bend | 8.09% | 3.82%(+4.26)#39 | 1.67%(+6.41)#958 |
| 40. | Hubbard | 7.88% | 3.82%(+4.05)#40 | 1.67%(+6.20)#993 |
| 41. | Imbler | 7.74% | 3.82%(+3.91)#41 | 1.67%(+6.06)#1,023 |
| 42. | Melrose | 7.65% | 3.82%(+3.83)#42 | 1.67%(+5.98)#1,046 |
| 43. | Wedderburn | 7.51% | 3.82%(+3.69)#43 | 1.67%(+5.84)#1,082 |
| 44. | West Linn | 7.40% | 3.82%(+3.57)#44 | 1.67%(+5.72)#1,101 |
| 45. | Aurora | 7.39% | 3.82%(+3.57)#45 | 1.67%(+5.72)#1,102 |
| 46. | Willamina | 7.39% | 3.82%(+3.57)#46 | 1.67%(+5.72)#1,103 |
| 47. | Svensen | 7.39% | 3.82%(+3.57)#47 | 1.67%(+5.71)#1,104 |
| 48. | Crooked River Ranch | 7.37% | 3.82%(+3.55)#48 | 1.67%(+5.70)#1,106 |
| 49. | Prineville Lake Acres | 7.35% | 3.82%(+3.52)#49 | 1.67%(+5.67)#1,112 |
| 50. | Powers | 7.28% | 3.82%(+3.45)#50 | 1.67%(+5.60)#1,132 |
| 51. | Sheridan | 7.25% | 3.82%(+3.42)#51 | 1.67%(+5.57)#1,138 |
| 52. | St Paul | 7.23% | 3.82%(+3.41)#52 | 1.67%(+5.56)#1,145 |
| 53. | Newport | 7.21% | 3.82%(+3.39)#53 | 1.67%(+5.54)#1,155 |
| 54. | Lebanon | 7.16% | 3.82%(+3.33)#54 | 1.67%(+5.48)#1,165 |
| 55. | Eagle Crest | 7.12% | 3.82%(+3.30)#55 | 1.67%(+5.45)#1,178 |
| 56. | Deer Island | 6.96% | 3.82%(+3.13)#56 | 1.67%(+5.28)#1,215 |
| 57. | Sodaville | 6.87% | 3.82%(+3.04)#57 | 1.67%(+5.19)#1,239 |
| 58. | Pine Hollow | 6.86% | 3.82%(+3.04)#58 | 1.67%(+5.19)#1,242 |
| 59. | Green | 6.76% | 3.82%(+2.94)#59 | 1.67%(+5.09)#1,279 |
| 60. | Garden Home Whitford | 6.65% | 3.82%(+2.82)#60 | 1.67%(+4.97)#1,313 |
| 61. | Harbor | 6.54% | 3.82%(+2.72)#61 | 1.67%(+4.87)#1,334 |
| 62. | Idanha | 6.38% | 3.82%(+2.56)#62 | 1.67%(+4.71)#1,381 |
| 63. | Barlow | 6.37% | 3.82%(+2.55)#63 | 1.67%(+4.70)#1,386 |
| 64. | Mcminnville | 6.24% | 3.82%(+2.41)#64 | 1.67%(+4.56)#1,445 |
| 65. | Aumsville | 6.23% | 3.82%(+2.41)#65 | 1.67%(+4.56)#1,446 |
| 66. | Roseburg North | 6.21% | 3.82%(+2.38)#66 | 1.67%(+4.53)#1,456 |
| 67. | Ashland | 6.14% | 3.82%(+2.31)#67 | 1.67%(+4.46)#1,479 |
| 68. | St Helens | 6.13% | 3.82%(+2.31)#68 | 1.67%(+4.45)#1,482 |
| 69. | Ukiah | 6.04% | 3.82%(+2.21)#69 | 1.67%(+4.36)#1,508 |
| 70. | Barnesdale | 5.95% | 3.82%(+2.12)#70 | 1.67%(+4.27)#1,552 |
| 71. | Wallowa | 5.94% | 3.82%(+2.12)#71 | 1.67%(+4.26)#1,556 |
| 72. | Donald | 5.91% | 3.82%(+2.08)#72 | 1.67%(+4.23)#1,567 |
| 73. | San Marine | 5.87% | 3.82%(+2.05)#73 | 1.67%(+4.20)#1,588 |
| 74. | Shady Cove | 5.77% | 3.82%(+1.95)#74 | 1.67%(+4.10)#1,629 |
| 75. | Maywood Park | 5.75% | 3.82%(+1.93)#75 | 1.67%(+4.08)#1,637 |
| 76. | Vernonia | 5.69% | 3.82%(+1.87)#76 | 1.67%(+4.01)#1,670 |
| 77. | Monroe | 5.63% | 3.82%(+1.80)#77 | 1.67%(+3.95)#1,708 |
| 78. | Mckay | 5.62% | 3.82%(+1.79)#78 | 1.67%(+3.94)#1,712 |
| 79. | Lonerock | 5.56% | 3.82%(+1.73)#79 | 1.67%(+3.88)#1,748 |
| 80. | King City | 5.53% | 3.82%(+1.71)#80 | 1.67%(+3.86)#1,761 |
| 81. | O Brien | 5.49% | 3.82%(+1.67)#81 | 1.67%(+3.82)#1,775 |
| 82. | West Haven Sylvan | 5.46% | 3.82%(+1.63)#82 | 1.67%(+3.78)#1,794 |
| 83. | Hines | 5.41% | 3.82%(+1.59)#83 | 1.67%(+3.74)#1,824 |
| 84. | Corvallis | 5.40% | 3.82%(+1.58)#84 | 1.67%(+3.73)#1,832 |
| 85. | Albany | 5.40% | 3.82%(+1.57)#85 | 1.67%(+3.72)#1,834 |
| 86. | Fair Oaks | 5.39% | 3.82%(+1.57)#86 | 1.67%(+3.72)#1,839 |
| 87. | Metzger | 5.34% | 3.82%(+1.52)#87 | 1.67%(+3.67)#1,871 |
| 88. | Yamhill | 5.32% | 3.82%(+1.50)#88 | 1.67%(+3.65)#1,883 |
| 89. | Paisley | 5.30% | 3.82%(+1.48)#89 | 1.67%(+3.63)#1,895 |
| 90. | Long Creek | 5.26% | 3.82%(+1.44)#90 | 1.67%(+3.59)#1,918 |
| 91. | Marlene | 5.20% | 3.82%(+1.38)#91 | 1.67%(+3.53)#1,951 |
| 92. | Oatfield | 5.16% | 3.82%(+1.34)#92 | 1.67%(+3.49)#1,977 |
| 93. | Tangent | 5.16% | 3.82%(+1.33)#93 | 1.67%(+3.48)#1,982 |
| 94. | Sisters | 5.15% | 3.82%(+1.32)#94 | 1.67%(+3.47)#1,988 |
| 95. | Keizer | 5.14% | 3.82%(+1.31)#95 | 1.67%(+3.46)#1,996 |
| 96. | Lake Oswego | 5.11% | 3.82%(+1.29)#96 | 1.67%(+3.44)#2,012 |
| 97. | Sherwood | 5.05% | 3.82%(+1.23)#97 | 1.67%(+3.38)#2,047 |
| 98. | Adrian | 5.05% | 3.82%(+1.23)#98 | 1.67%(+3.38)#2,049 |
| 99. | Newberg | 5.04% | 3.82%(+1.21)#99 | 1.67%(+3.36)#2,056 |
| 100. | Spray | 5.03% | 3.82%(+1.20)#100 | 1.67%(+3.35)#2,059 |
Common Questions
What are the Top 10 Cities with the Highest Percentage of European Population in Oregon?
Top 10 Cities with the Highest Percentage of European Population in Oregon are:
#1
40.29%
#2
39.58%
#3
26.09%
#4
19.16%
#5
17.31%
#6
15.89%
#7
15.83%
#8
15.50%
#9
15.24%
#10
13.68%
What city has the Highest Percentage of European Population in Oregon?
Beaver has the Highest Percentage of European Population in Oregon with 40.29%.
What is the Percentage of European Population in the State of Oregon?
Percentage of European Population in Oregon is 3.82%.
What is the Percentage of European Population in the United States?
Percentage of European Population in the United States is 1.67%.