Cities with the Highest Percentage of European Population in Kentucky
RELATED REPORTS & OPTIONS
European
Kentucky
Compare Cities
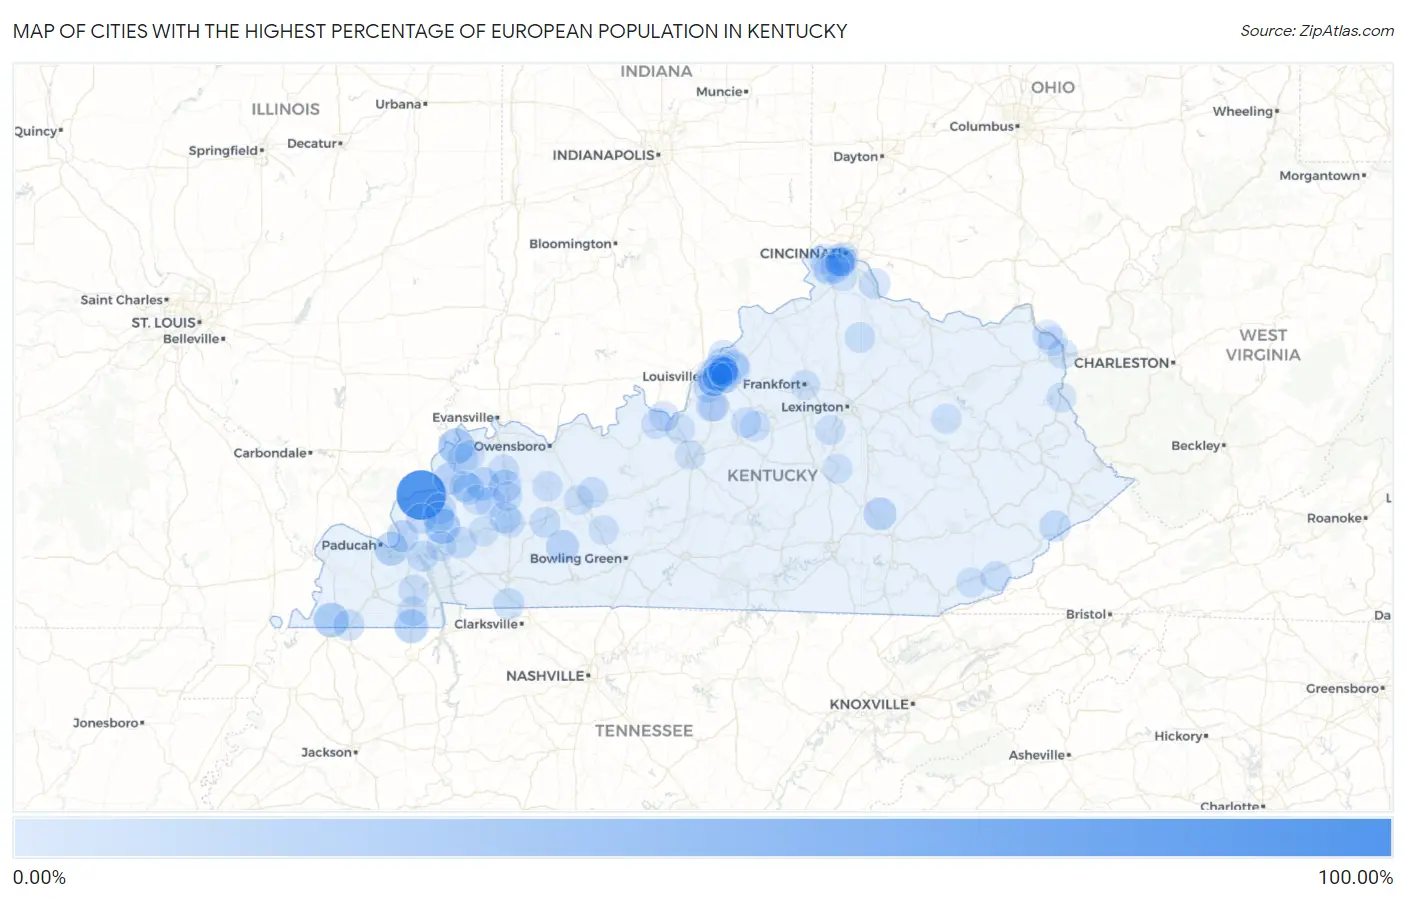
Map of Cities with the Highest Percentage of European Population in Kentucky
0.00%
100.00%
Cities with the Highest Percentage of European Population in Kentucky
| City | European | vs State | vs National | |
| 1. | Tolu | 100.00% | 1.89%(+98.1)#1 | 1.67%(+98.3)#6 |
| 2. | Uniontown | 31.01% | 1.89%(+29.1)#2 | 1.67%(+29.3)#72 |
| 3. | Fredonia | 27.58% | 1.89%(+25.7)#3 | 1.67%(+25.9)#97 |
| 4. | Cayce | 25.00% | 1.89%(+23.1)#4 | 1.67%(+23.3)#114 |
| 5. | Hazel | 20.76% | 1.89%(+18.9)#5 | 1.67%(+19.1)#168 |
| 6. | Ledbetter | 20.50% | 1.89%(+18.6)#6 | 1.67%(+18.8)#172 |
| 7. | Dixon | 17.81% | 1.89%(+15.9)#7 | 1.67%(+16.1)#224 |
| 8. | Livingston | 16.46% | 1.89%(+14.6)#8 | 1.67%(+14.8)#253 |
| 9. | Slaughters | 15.92% | 1.89%(+14.0)#9 | 1.67%(+14.2)#276 |
| 10. | Dunmor | 15.31% | 1.89%(+13.4)#10 | 1.67%(+13.6)#300 |
| 11. | Sturgis | 15.12% | 1.89%(+13.2)#11 | 1.67%(+13.4)#312 |
| 12. | Smithland | 12.04% | 1.89%(+10.1)#12 | 1.67%(+10.4)#463 |
| 13. | Earlington | 10.83% | 1.89%(+8.93)#13 | 1.67%(+9.15)#560 |
| 14. | Clay | 10.66% | 1.89%(+8.76)#14 | 1.67%(+8.98)#578 |
| 15. | Marion | 10.36% | 1.89%(+8.47)#15 | 1.67%(+8.69)#618 |
| 16. | Crayne | 10.27% | 1.89%(+8.38)#16 | 1.67%(+8.60)#627 |
| 17. | Meadowbrook Farm | 9.43% | 1.89%(+7.54)#17 | 1.67%(+7.76)#728 |
| 18. | Princeton | 9.15% | 1.89%(+7.26)#18 | 1.67%(+7.48)#766 |
| 19. | Mcroberts | 9.09% | 1.89%(+7.20)#19 | 1.67%(+7.42)#773 |
| 20. | Fort Campbell North | 9.00% | 1.89%(+7.10)#20 | 1.67%(+7.32)#796 |
| 21. | Fulton | 8.73% | 1.89%(+6.83)#21 | 1.67%(+7.05)#841 |
| 22. | Wheatcroft | 8.39% | 1.89%(+6.50)#22 | 1.67%(+6.72)#896 |
| 23. | Ten Broeck | 8.22% | 1.89%(+6.33)#23 | 1.67%(+6.54)#924 |
| 24. | Powderly | 7.66% | 1.89%(+5.76)#24 | 1.67%(+5.98)#1,045 |
| 25. | Grand Rivers | 7.41% | 1.89%(+5.51)#25 | 1.67%(+5.73)#1,097 |
| 26. | Crescent Springs | 7.31% | 1.89%(+5.42)#26 | 1.67%(+5.64)#1,125 |
| 27. | Pewee Valley | 7.07% | 1.89%(+5.17)#27 | 1.67%(+5.39)#1,189 |
| 28. | Seneca Gardens | 6.84% | 1.89%(+4.95)#28 | 1.67%(+5.17)#1,247 |
| 29. | Mockingbird Valley | 6.83% | 1.89%(+4.94)#29 | 1.67%(+5.16)#1,252 |
| 30. | Mentor | 6.73% | 1.89%(+4.84)#30 | 1.67%(+5.06)#1,283 |
| 31. | Glenview Hills | 6.67% | 1.89%(+4.77)#31 | 1.67%(+4.99)#1,300 |
| 32. | Fox Chase | 6.50% | 1.89%(+4.60)#32 | 1.67%(+4.82)#1,347 |
| 33. | Woodlawn Park | 6.44% | 1.89%(+4.55)#33 | 1.67%(+4.77)#1,365 |
| 34. | Rosine | 6.40% | 1.89%(+4.51)#34 | 1.67%(+4.73)#1,377 |
| 35. | Morganfield | 6.35% | 1.89%(+4.46)#35 | 1.67%(+4.68)#1,393 |
| 36. | Sebree | 6.23% | 1.89%(+4.34)#36 | 1.67%(+4.55)#1,449 |
| 37. | Norwood | 6.17% | 1.89%(+4.28)#37 | 1.67%(+4.50)#1,469 |
| 38. | Druid Hills | 5.99% | 1.89%(+4.10)#38 | 1.67%(+4.32)#1,530 |
| 39. | Berry | 5.49% | 1.89%(+3.59)#39 | 1.67%(+3.81)#1,776 |
| 40. | Salem | 5.46% | 1.89%(+3.57)#40 | 1.67%(+3.79)#1,791 |
| 41. | Van Lear | 5.44% | 1.89%(+3.55)#41 | 1.67%(+3.77)#1,805 |
| 42. | Graymoor Devondale | 5.41% | 1.89%(+3.52)#42 | 1.67%(+3.74)#1,822 |
| 43. | Hardin | 5.41% | 1.89%(+3.51)#43 | 1.67%(+3.73)#1,827 |
| 44. | Thruston | 4.98% | 1.89%(+3.09)#44 | 1.67%(+3.31)#2,092 |
| 45. | Oakbrook | 4.96% | 1.89%(+3.06)#45 | 1.67%(+3.28)#2,106 |
| 46. | Bloomfield | 4.94% | 1.89%(+3.04)#46 | 1.67%(+3.26)#2,120 |
| 47. | Ekron | 4.86% | 1.89%(+2.97)#47 | 1.67%(+3.19)#2,165 |
| 48. | Eddyville | 4.74% | 1.89%(+2.85)#48 | 1.67%(+3.07)#2,241 |
| 49. | Livermore | 4.71% | 1.89%(+2.81)#49 | 1.67%(+3.03)#2,264 |
| 50. | Lynnview | 4.68% | 1.89%(+2.79)#50 | 1.67%(+3.01)#2,286 |
| 51. | Prospect | 4.65% | 1.89%(+2.76)#51 | 1.67%(+2.98)#2,308 |
| 52. | Fairfield | 4.59% | 1.89%(+2.70)#52 | 1.67%(+2.92)#2,345 |
| 53. | Evarts | 4.58% | 1.89%(+2.68)#53 | 1.67%(+2.90)#2,361 |
| 54. | Langdon Place | 4.50% | 1.89%(+2.61)#54 | 1.67%(+2.83)#2,447 |
| 55. | Crestview Hills | 4.48% | 1.89%(+2.59)#55 | 1.67%(+2.81)#2,459 |
| 56. | Goshen | 4.44% | 1.89%(+2.54)#56 | 1.67%(+2.76)#2,508 |
| 57. | Philpot | 4.43% | 1.89%(+2.54)#57 | 1.67%(+2.76)#2,509 |
| 58. | Hurstbourne | 4.34% | 1.89%(+2.45)#58 | 1.67%(+2.67)#2,598 |
| 59. | Doe Valley | 4.33% | 1.89%(+2.44)#59 | 1.67%(+2.65)#2,610 |
| 60. | Strathmoor Manor | 4.32% | 1.89%(+2.43)#60 | 1.67%(+2.65)#2,615 |
| 61. | Hebron Estates | 4.20% | 1.89%(+2.31)#61 | 1.67%(+2.53)#2,730 |
| 62. | Kingsley | 4.11% | 1.89%(+2.22)#62 | 1.67%(+2.44)#2,829 |
| 63. | Catlettsburg | 3.98% | 1.89%(+2.09)#63 | 1.67%(+2.31)#2,974 |
| 64. | Murray | 3.97% | 1.89%(+2.08)#64 | 1.67%(+2.30)#2,986 |
| 65. | Nebo | 3.94% | 1.89%(+2.05)#65 | 1.67%(+2.27)#3,024 |
| 66. | Hills And Dales | 3.91% | 1.89%(+2.01)#66 | 1.67%(+2.23)#3,075 |
| 67. | Park Hills | 3.86% | 1.89%(+1.97)#67 | 1.67%(+2.19)#3,133 |
| 68. | Crestwood | 3.85% | 1.89%(+1.96)#68 | 1.67%(+2.18)#3,148 |
| 69. | Brownsboro Farm | 3.80% | 1.89%(+1.90)#69 | 1.67%(+2.12)#3,228 |
| 70. | Bellefonte | 3.78% | 1.89%(+1.89)#70 | 1.67%(+2.11)#3,245 |
| 71. | Waverly | 3.68% | 1.89%(+1.79)#71 | 1.67%(+2.01)#3,372 |
| 72. | Manor Creek | 3.64% | 1.89%(+1.74)#72 | 1.67%(+1.96)#3,441 |
| 73. | Independence | 3.62% | 1.89%(+1.73)#73 | 1.67%(+1.95)#3,457 |
| 74. | Richlawn | 3.60% | 1.89%(+1.71)#74 | 1.67%(+1.93)#3,480 |
| 75. | South Wallins | 3.59% | 1.89%(+1.69)#75 | 1.67%(+1.91)#3,501 |
| 76. | Raceland | 3.57% | 1.89%(+1.68)#76 | 1.67%(+1.90)#3,518 |
| 77. | Mortons Gap | 3.57% | 1.89%(+1.67)#77 | 1.67%(+1.89)#3,531 |
| 78. | Hebron | 3.54% | 1.89%(+1.65)#78 | 1.67%(+1.87)#3,566 |
| 79. | Goose Creek | 3.48% | 1.89%(+1.59)#79 | 1.67%(+1.81)#3,640 |
| 80. | Elizabethtown | 3.41% | 1.89%(+1.51)#80 | 1.67%(+1.73)#3,744 |
| 81. | Wilmore | 3.37% | 1.89%(+1.48)#81 | 1.67%(+1.70)#3,797 |
| 82. | Florence | 3.35% | 1.89%(+1.46)#82 | 1.67%(+1.68)#3,836 |
| 83. | Providence | 3.26% | 1.89%(+1.37)#83 | 1.67%(+1.59)#3,986 |
| 84. | Louisa | 3.24% | 1.89%(+1.35)#84 | 1.67%(+1.57)#4,014 |
| 85. | Fort Knox | 3.22% | 1.89%(+1.33)#85 | 1.67%(+1.55)#4,050 |
| 86. | Dawson Springs | 3.21% | 1.89%(+1.31)#86 | 1.67%(+1.53)#4,076 |
| 87. | Beaver Dam | 3.20% | 1.89%(+1.30)#87 | 1.67%(+1.52)#4,096 |
| 88. | Fort Wright | 3.17% | 1.89%(+1.27)#88 | 1.67%(+1.49)#4,153 |
| 89. | St Matthews | 3.16% | 1.89%(+1.27)#89 | 1.67%(+1.49)#4,158 |
| 90. | Fort Mitchell | 3.15% | 1.89%(+1.26)#90 | 1.67%(+1.48)#4,179 |
| 91. | Pleasant Ridge | 3.15% | 1.89%(+1.25)#91 | 1.67%(+1.47)#4,197 |
| 92. | Lakeside Park | 3.14% | 1.89%(+1.25)#92 | 1.67%(+1.47)#4,202 |
| 93. | Blue Ridge Manor | 3.04% | 1.89%(+1.15)#93 | 1.67%(+1.37)#4,375 |
| 94. | Frenchburg | 3.04% | 1.89%(+1.14)#94 | 1.67%(+1.36)#4,388 |
| 95. | Frankfort | 3.03% | 1.89%(+1.13)#95 | 1.67%(+1.35)#4,413 |
| 96. | Westwood | 3.02% | 1.89%(+1.13)#96 | 1.67%(+1.35)#4,415 |
| 97. | Lancaster | 3.02% | 1.89%(+1.12)#97 | 1.67%(+1.34)#4,430 |
| 98. | Woodbury | 2.99% | 1.89%(+1.09)#98 | 1.67%(+1.31)#4,495 |
| 99. | Hanson | 2.96% | 1.89%(+1.06)#99 | 1.67%(+1.28)#4,558 |
| 100. | Elsmere | 2.95% | 1.89%(+1.05)#100 | 1.67%(+1.27)#4,573 |
Common Questions
What are the Top 10 Cities with the Highest Percentage of European Population in Kentucky?
Top 10 Cities with the Highest Percentage of European Population in Kentucky are:
#1
100.00%
#2
31.01%
#3
27.58%
#4
25.00%
#5
20.76%
#6
20.50%
#7
17.81%
#8
16.46%
#9
15.92%
#10
15.31%
What city has the Highest Percentage of European Population in Kentucky?
Tolu has the Highest Percentage of European Population in Kentucky with 100.00%.
What is the Percentage of European Population in the State of Kentucky?
Percentage of European Population in Kentucky is 1.89%.
What is the Percentage of European Population in the United States?
Percentage of European Population in the United States is 1.67%.