Cities with the Highest Percentage of European Population in Tennessee
RELATED REPORTS & OPTIONS
European
Tennessee
Compare Cities
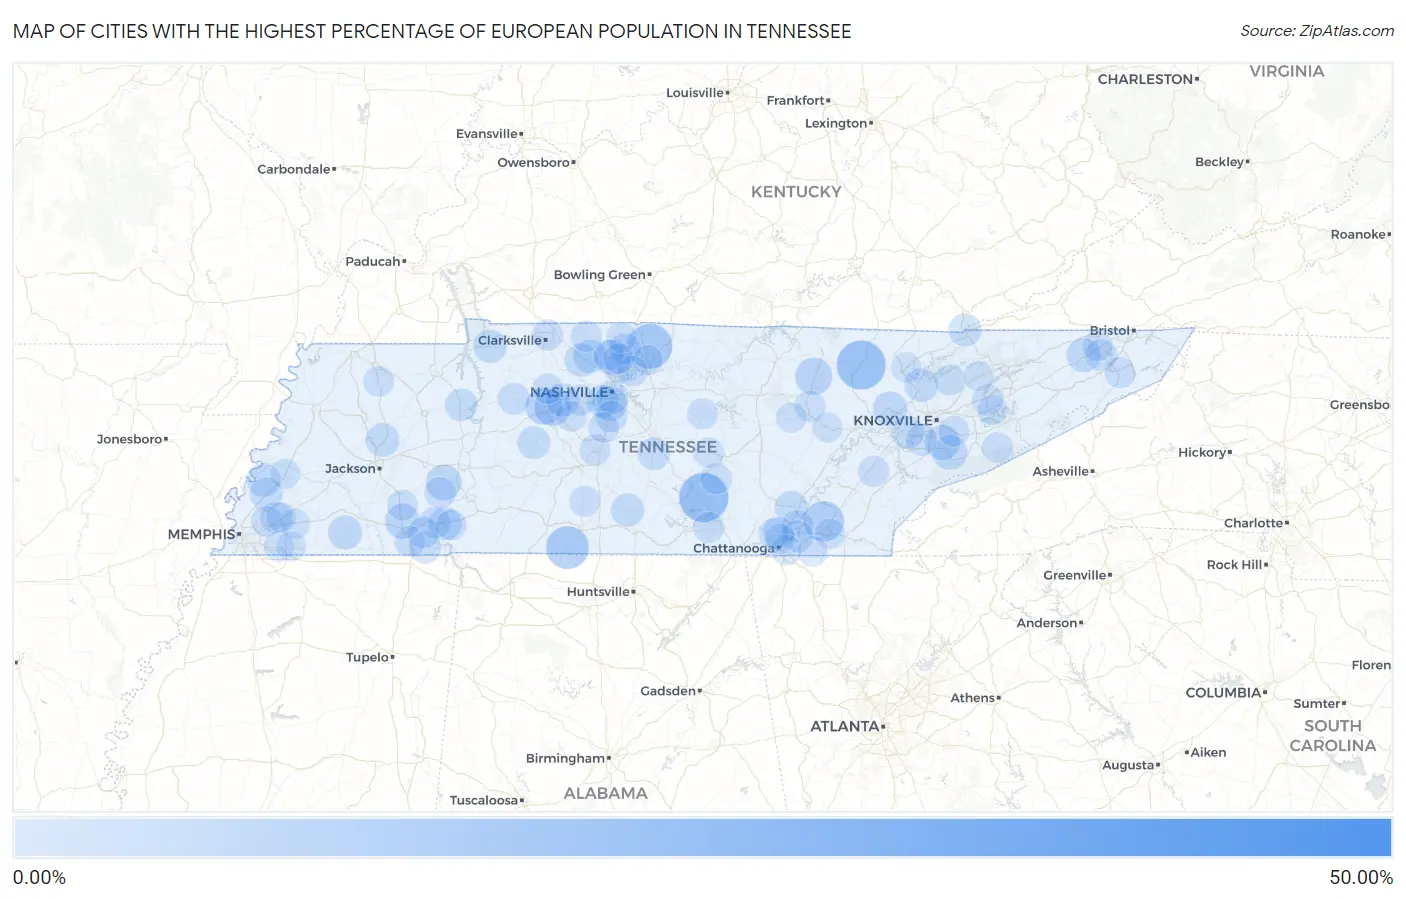
Map of Cities with the Highest Percentage of European Population in Tennessee
0.00%
50.00%
Cities with the Highest Percentage of European Population in Tennessee
| City | European | vs State | vs National | |
| 1. | Dancyville | 50.00% | 2.09%(+47.9)#1 | 1.67%(+48.3)#32 |
| 2. | Hillsboro | 20.58% | 2.09%(+18.5)#2 | 1.67%(+18.9)#170 |
| 3. | Robbins | 20.18% | 2.09%(+18.1)#3 | 1.67%(+18.5)#178 |
| 4. | Graball | 16.20% | 2.09%(+14.1)#4 | 1.67%(+14.5)#266 |
| 5. | Minor Hill | 14.43% | 2.09%(+12.3)#5 | 1.67%(+12.8)#347 |
| 6. | Hopewell | 12.29% | 2.09%(+10.2)#6 | 1.67%(+10.6)#448 |
| 7. | Grimsley | 9.18% | 2.09%(+7.09)#7 | 1.67%(+7.51)#763 |
| 8. | Dickson | 9.00% | 2.09%(+6.90)#8 | 1.67%(+7.32)#797 |
| 9. | Burns | 8.93% | 2.09%(+6.84)#9 | 1.67%(+7.26)#804 |
| 10. | Scotts Hill | 7.92% | 2.09%(+5.82)#10 | 1.67%(+6.24)#986 |
| 11. | Ridgetop | 7.83% | 2.09%(+5.73)#11 | 1.67%(+6.15)#1,006 |
| 12. | Bethel Springs | 7.55% | 2.09%(+5.45)#12 | 1.67%(+5.87)#1,067 |
| 13. | Wildwood | 7.24% | 2.09%(+5.14)#13 | 1.67%(+5.56)#1,141 |
| 14. | Walland | 7.11% | 2.09%(+5.01)#14 | 1.67%(+5.43)#1,182 |
| 15. | Oak Hill | 6.86% | 2.09%(+4.77)#15 | 1.67%(+5.19)#1,240 |
| 16. | Oliver Springs | 6.68% | 2.09%(+4.59)#16 | 1.67%(+5.01)#1,295 |
| 17. | Hickory Valley | 6.47% | 2.09%(+4.38)#17 | 1.67%(+4.80)#1,353 |
| 18. | Fall Branch | 6.40% | 2.09%(+4.31)#18 | 1.67%(+4.73)#1,376 |
| 19. | Norris | 6.09% | 2.09%(+4.00)#19 | 1.67%(+4.42)#1,492 |
| 20. | Gilt Edge | 6.04% | 2.09%(+3.95)#20 | 1.67%(+4.37)#1,507 |
| 21. | Medina | 6.03% | 2.09%(+3.94)#21 | 1.67%(+4.36)#1,512 |
| 22. | White Bluff | 5.98% | 2.09%(+3.89)#22 | 1.67%(+4.31)#1,538 |
| 23. | Dover | 5.79% | 2.09%(+3.70)#23 | 1.67%(+4.12)#1,617 |
| 24. | Coopertown | 5.78% | 2.09%(+3.68)#24 | 1.67%(+4.10)#1,627 |
| 25. | Petersburg | 5.76% | 2.09%(+3.66)#25 | 1.67%(+4.08)#1,636 |
| 26. | Savannah | 5.75% | 2.09%(+3.65)#26 | 1.67%(+4.07)#1,641 |
| 27. | Flat Top Mountain | 5.72% | 2.09%(+3.63)#27 | 1.67%(+4.05)#1,657 |
| 28. | Pleasant View | 5.66% | 2.09%(+3.57)#28 | 1.67%(+3.99)#1,687 |
| 29. | Cumberland Gap | 5.59% | 2.09%(+3.49)#29 | 1.67%(+3.91)#1,732 |
| 30. | Munford | 5.41% | 2.09%(+3.32)#30 | 1.67%(+3.74)#1,823 |
| 31. | Centerville | 5.38% | 2.09%(+3.28)#31 | 1.67%(+3.70)#1,846 |
| 32. | Berry Hill | 5.15% | 2.09%(+3.06)#32 | 1.67%(+3.48)#1,986 |
| 33. | Farragut | 5.13% | 2.09%(+3.04)#33 | 1.67%(+3.46)#1,999 |
| 34. | Camden | 5.07% | 2.09%(+2.97)#34 | 1.67%(+3.39)#2,038 |
| 35. | Belle Meade | 4.98% | 2.09%(+2.88)#35 | 1.67%(+3.30)#2,096 |
| 36. | Christiana | 4.90% | 2.09%(+2.80)#36 | 1.67%(+3.22)#2,140 |
| 37. | Lakesite | 4.82% | 2.09%(+2.72)#37 | 1.67%(+3.14)#2,195 |
| 38. | Michie | 4.53% | 2.09%(+2.43)#38 | 1.67%(+2.85)#2,415 |
| 39. | Mcewen | 4.51% | 2.09%(+2.41)#39 | 1.67%(+2.83)#2,442 |
| 40. | Lakeland | 4.47% | 2.09%(+2.37)#40 | 1.67%(+2.79)#2,477 |
| 41. | Crump | 4.42% | 2.09%(+2.32)#41 | 1.67%(+2.75)#2,522 |
| 42. | Oak Grove Cdp Washington County | 4.34% | 2.09%(+2.25)#42 | 1.67%(+2.67)#2,595 |
| 43. | Harrison | 4.27% | 2.09%(+2.18)#43 | 1.67%(+2.60)#2,661 |
| 44. | Stantonville | 4.25% | 2.09%(+2.16)#44 | 1.67%(+2.58)#2,683 |
| 45. | Brentwood | 4.21% | 2.09%(+2.12)#45 | 1.67%(+2.54)#2,720 |
| 46. | Louisville | 4.20% | 2.09%(+2.10)#46 | 1.67%(+2.52)#2,735 |
| 47. | Gray | 4.15% | 2.09%(+2.06)#47 | 1.67%(+2.48)#2,777 |
| 48. | Goodlettsville | 4.13% | 2.09%(+2.04)#48 | 1.67%(+2.46)#2,808 |
| 49. | Walden | 4.05% | 2.09%(+1.96)#49 | 1.67%(+2.38)#2,902 |
| 50. | Sweetwater | 3.95% | 2.09%(+1.85)#50 | 1.67%(+2.27)#3,018 |
| 51. | Clarksville | 3.94% | 2.09%(+1.85)#51 | 1.67%(+2.27)#3,020 |
| 52. | Walnut Grove Cdp Sumner County | 3.94% | 2.09%(+1.84)#52 | 1.67%(+2.27)#3,027 |
| 53. | Cedar Hill | 3.92% | 2.09%(+1.83)#53 | 1.67%(+2.25)#3,052 |
| 54. | Sardis | 3.92% | 2.09%(+1.82)#54 | 1.67%(+2.24)#3,060 |
| 55. | White House | 3.91% | 2.09%(+1.81)#55 | 1.67%(+2.23)#3,071 |
| 56. | Mayland | 3.86% | 2.09%(+1.76)#56 | 1.67%(+2.19)#3,138 |
| 57. | Spring Hill | 3.81% | 2.09%(+1.72)#57 | 1.67%(+2.14)#3,201 |
| 58. | Viola | 3.81% | 2.09%(+1.71)#58 | 1.67%(+2.14)#3,209 |
| 59. | Sewanee | 3.80% | 2.09%(+1.70)#59 | 1.67%(+2.12)#3,223 |
| 60. | Pegram | 3.78% | 2.09%(+1.69)#60 | 1.67%(+2.11)#3,244 |
| 61. | Jefferson City | 3.73% | 2.09%(+1.64)#61 | 1.67%(+2.06)#3,313 |
| 62. | Maynardville | 3.71% | 2.09%(+1.61)#62 | 1.67%(+2.03)#3,340 |
| 63. | Liberty | 3.68% | 2.09%(+1.59)#63 | 1.67%(+2.01)#3,369 |
| 64. | Lynnville | 3.66% | 2.09%(+1.57)#64 | 1.67%(+1.99)#3,400 |
| 65. | Pine Crest | 3.65% | 2.09%(+1.56)#65 | 1.67%(+1.98)#3,420 |
| 66. | Bowman | 3.65% | 2.09%(+1.55)#66 | 1.67%(+1.98)#3,421 |
| 67. | Signal Mountain | 3.51% | 2.09%(+1.41)#67 | 1.67%(+1.84)#3,607 |
| 68. | Olivet | 3.50% | 2.09%(+1.41)#68 | 1.67%(+1.83)#3,619 |
| 69. | Pittman Center | 3.46% | 2.09%(+1.37)#69 | 1.67%(+1.79)#3,674 |
| 70. | Hendersonville | 3.45% | 2.09%(+1.35)#70 | 1.67%(+1.77)#3,688 |
| 71. | Seymour | 3.42% | 2.09%(+1.33)#71 | 1.67%(+1.75)#3,730 |
| 72. | Franklin | 3.40% | 2.09%(+1.31)#72 | 1.67%(+1.73)#3,750 |
| 73. | Finger | 3.38% | 2.09%(+1.28)#73 | 1.67%(+1.70)#3,793 |
| 74. | Greenbrier | 3.36% | 2.09%(+1.27)#74 | 1.67%(+1.69)#3,811 |
| 75. | Eastview | 3.35% | 2.09%(+1.26)#75 | 1.67%(+1.68)#3,833 |
| 76. | Sharon | 3.34% | 2.09%(+1.24)#76 | 1.67%(+1.66)#3,856 |
| 77. | Bartlett | 3.28% | 2.09%(+1.19)#77 | 1.67%(+1.61)#3,954 |
| 78. | Millersville | 3.28% | 2.09%(+1.19)#78 | 1.67%(+1.61)#3,956 |
| 79. | Centertown | 3.25% | 2.09%(+1.15)#79 | 1.67%(+1.57)#4,009 |
| 80. | Collierville | 3.22% | 2.09%(+1.13)#80 | 1.67%(+1.55)#4,047 |
| 81. | Charlotte | 3.20% | 2.09%(+1.11)#81 | 1.67%(+1.53)#4,083 |
| 82. | East Cleveland | 3.17% | 2.09%(+1.07)#82 | 1.67%(+1.49)#4,149 |
| 83. | Ridgeside | 3.16% | 2.09%(+1.06)#83 | 1.67%(+1.48)#4,166 |
| 84. | Cross Plains | 3.12% | 2.09%(+1.03)#84 | 1.67%(+1.45)#4,231 |
| 85. | Apison | 3.12% | 2.09%(+1.02)#85 | 1.67%(+1.45)#4,242 |
| 86. | Fairview | 3.11% | 2.09%(+1.01)#86 | 1.67%(+1.44)#4,263 |
| 87. | Oakland | 3.10% | 2.09%(+1.00)#87 | 1.67%(+1.42)#4,284 |
| 88. | Pleasant Hill | 3.06% | 2.09%(+0.961)#88 | 1.67%(+1.38)#4,359 |
| 89. | Red Bank | 3.04% | 2.09%(+0.942)#89 | 1.67%(+1.36)#4,392 |
| 90. | Jacksboro | 2.99% | 2.09%(+0.896)#90 | 1.67%(+1.32)#4,486 |
| 91. | Colonial Heights | 2.96% | 2.09%(+0.867)#91 | 1.67%(+1.29)#4,542 |
| 92. | Gallatin | 2.95% | 2.09%(+0.860)#92 | 1.67%(+1.28)#4,560 |
| 93. | Dandridge | 2.92% | 2.09%(+0.830)#93 | 1.67%(+1.25)#4,617 |
| 94. | Covington | 2.92% | 2.09%(+0.820)#94 | 1.67%(+1.24)#4,641 |
| 95. | Arlington | 2.91% | 2.09%(+0.813)#95 | 1.67%(+1.23)#4,663 |
| 96. | Rutledge | 2.90% | 2.09%(+0.808)#96 | 1.67%(+1.23)#4,670 |
| 97. | Powell | 2.90% | 2.09%(+0.807)#97 | 1.67%(+1.23)#4,672 |
| 98. | Piperton | 2.89% | 2.09%(+0.799)#98 | 1.67%(+1.22)#4,694 |
| 99. | Crab Orchard | 2.88% | 2.09%(+0.785)#99 | 1.67%(+1.21)#4,735 |
| 100. | Finley | 2.86% | 2.09%(+0.762)#100 | 1.67%(+1.18)#4,788 |
Common Questions
What are the Top 10 Cities with the Highest Percentage of European Population in Tennessee?
Top 10 Cities with the Highest Percentage of European Population in Tennessee are:
#1
20.58%
#2
20.18%
#3
16.20%
#4
14.43%
#5
12.29%
#6
9.18%
#7
9.00%
#8
8.93%
#9
7.92%
#10
7.83%
What city has the Highest Percentage of European Population in Tennessee?
Hillsboro has the Highest Percentage of European Population in Tennessee with 20.58%.
What is the Percentage of European Population in the State of Tennessee?
Percentage of European Population in Tennessee is 2.09%.
What is the Percentage of European Population in the United States?
Percentage of European Population in the United States is 1.67%.