Cities with the Highest Percentage of European Population in Indiana
RELATED REPORTS & OPTIONS
European
Indiana
Compare Cities
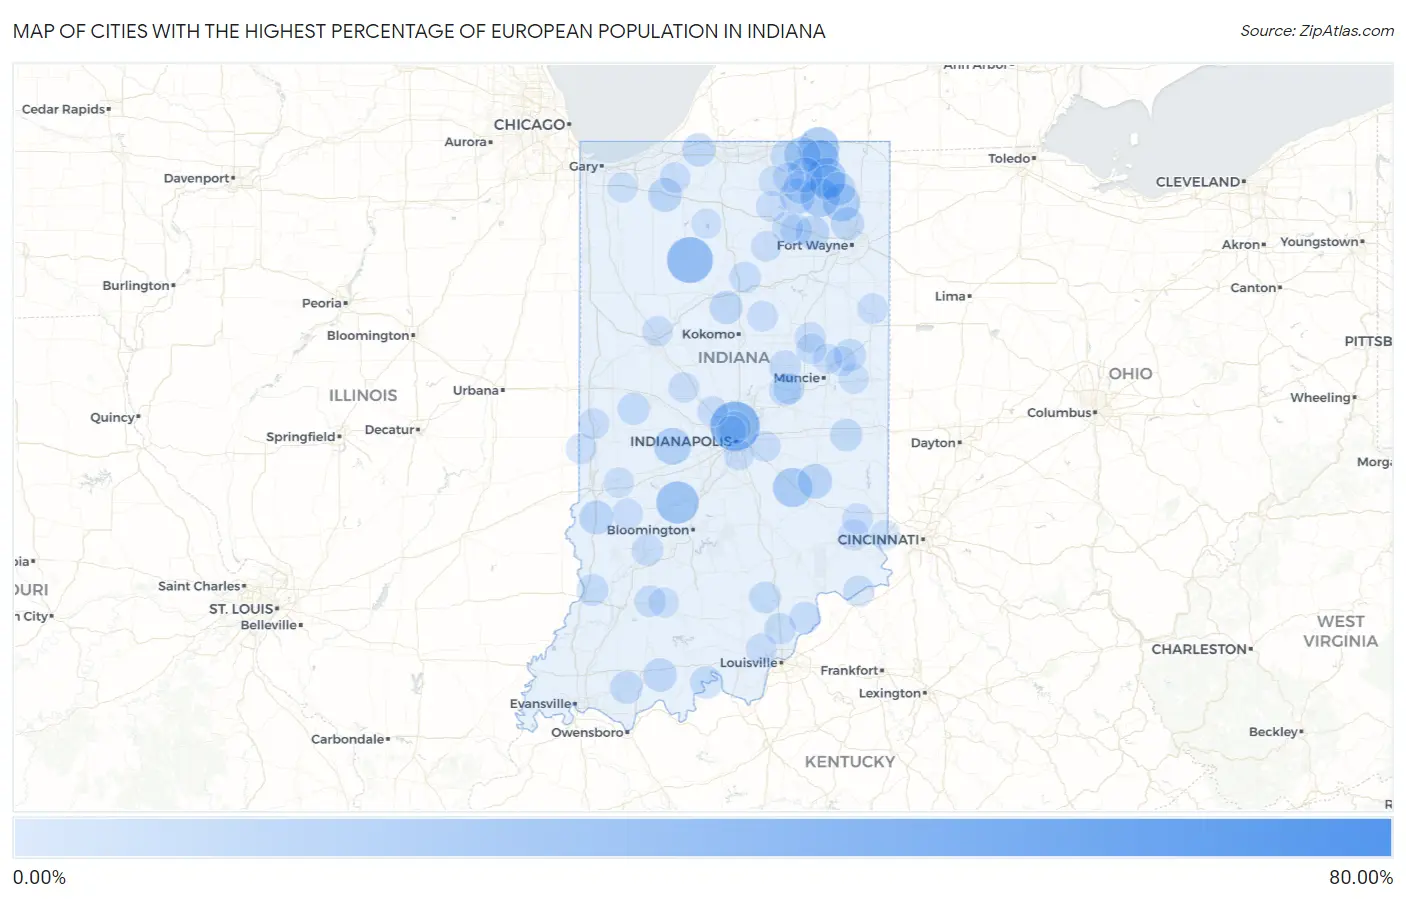
Map of Cities with the Highest Percentage of European Population in Indiana
0.00%
80.00%
Cities with the Highest Percentage of European Population in Indiana
| City | European | vs State | vs National | |
| 1. | Scott | 68.32% | 1.92%(+66.4)#1 | 1.67%(+66.6)#16 |
| 2. | Blooming Grove | 52.13% | 1.92%(+50.2)#2 | 1.67%(+50.5)#24 |
| 3. | Lake Everett | 50.00% | 1.92%(+48.1)#3 | 1.67%(+48.3)#30 |
| 4. | North Crows Nest | 36.62% | 1.92%(+34.7)#4 | 1.67%(+34.9)#61 |
| 5. | Cree Lake | 32.14% | 1.92%(+30.2)#5 | 1.67%(+30.5)#67 |
| 6. | Wadesville | 30.95% | 1.92%(+29.0)#6 | 1.67%(+29.3)#73 |
| 7. | Star City | 30.53% | 1.92%(+28.6)#7 | 1.67%(+28.9)#77 |
| 8. | Gosport | 24.31% | 1.92%(+22.4)#8 | 1.67%(+22.6)#120 |
| 9. | Wawaka | 23.17% | 1.92%(+21.2)#9 | 1.67%(+21.5)#131 |
| 10. | Howe | 21.67% | 1.92%(+19.7)#10 | 1.67%(+20.0)#153 |
| 11. | Wolcottville | 19.39% | 1.92%(+17.5)#11 | 1.67%(+17.7)#196 |
| 12. | Waldron | 18.93% | 1.92%(+17.0)#12 | 1.67%(+17.3)#207 |
| 13. | Albion | 18.31% | 1.92%(+16.4)#13 | 1.67%(+16.6)#212 |
| 14. | Lyford | 18.21% | 1.92%(+16.3)#14 | 1.67%(+16.5)#214 |
| 15. | Lagrange | 16.92% | 1.92%(+15.0)#15 | 1.67%(+15.2)#241 |
| 16. | Avilla | 16.77% | 1.92%(+14.8)#16 | 1.67%(+15.1)#245 |
| 17. | Laud | 16.49% | 1.92%(+14.6)#17 | 1.67%(+14.8)#252 |
| 18. | Schaefer Lake | 16.27% | 1.92%(+14.3)#18 | 1.67%(+14.6)#265 |
| 19. | Heritage Lake | 15.02% | 1.92%(+13.1)#19 | 1.67%(+13.3)#318 |
| 20. | Mace | 14.84% | 1.92%(+12.9)#20 | 1.67%(+13.2)#322 |
| 21. | Hashtown | 14.75% | 1.92%(+12.8)#21 | 1.67%(+13.1)#327 |
| 22. | Eckerty | 14.29% | 1.92%(+12.4)#22 | 1.67%(+12.6)#352 |
| 23. | Shipshewana | 14.09% | 1.92%(+12.2)#23 | 1.67%(+12.4)#362 |
| 24. | Cromwell | 12.71% | 1.92%(+10.8)#24 | 1.67%(+11.0)#414 |
| 25. | Topeka | 12.10% | 1.92%(+10.2)#25 | 1.67%(+10.4)#460 |
| 26. | Rome City | 11.48% | 1.92%(+9.56)#26 | 1.67%(+9.81)#503 |
| 27. | Wolflake | 11.19% | 1.92%(+9.27)#27 | 1.67%(+9.52)#532 |
| 28. | Milroy | 11.01% | 1.92%(+9.09)#28 | 1.67%(+9.34)#544 |
| 29. | Amity | 10.68% | 1.92%(+8.76)#29 | 1.67%(+9.01)#572 |
| 30. | Leiters Ford | 10.66% | 1.92%(+8.74)#30 | 1.67%(+8.99)#576 |
| 31. | South Milford | 10.61% | 1.92%(+8.68)#31 | 1.67%(+8.93)#584 |
| 32. | Homer | 10.59% | 1.92%(+8.67)#32 | 1.67%(+8.92)#589 |
| 33. | Farmersburg | 10.13% | 1.92%(+8.21)#33 | 1.67%(+8.46)#640 |
| 34. | Hanna | 9.91% | 1.92%(+7.98)#34 | 1.67%(+8.23)#668 |
| 35. | Center | 9.70% | 1.92%(+7.78)#35 | 1.67%(+8.03)#694 |
| 36. | Columbia City | 9.65% | 1.92%(+7.73)#36 | 1.67%(+7.98)#700 |
| 37. | Kendallville | 9.25% | 1.92%(+7.32)#37 | 1.67%(+7.57)#751 |
| 38. | St Meinrad | 9.16% | 1.92%(+7.24)#38 | 1.67%(+7.49)#765 |
| 39. | Huntertown | 8.86% | 1.92%(+6.93)#39 | 1.67%(+7.18)#815 |
| 40. | Walton | 8.70% | 1.92%(+6.78)#40 | 1.67%(+7.03)#844 |
| 41. | Merriam | 8.57% | 1.92%(+6.65)#41 | 1.67%(+6.90)#856 |
| 42. | New Carlisle | 8.51% | 1.92%(+6.59)#42 | 1.67%(+6.84)#869 |
| 43. | Ligonier | 7.80% | 1.92%(+5.88)#43 | 1.67%(+6.13)#1,016 |
| 44. | Tennyson | 7.69% | 1.92%(+5.77)#44 | 1.67%(+6.02)#1,034 |
| 45. | Alton | 7.69% | 1.92%(+5.77)#45 | 1.67%(+6.02)#1,038 |
| 46. | Mount Auburn | 7.53% | 1.92%(+5.60)#47 | 1.67%(+5.85)#1,075 |
| 47. | Crows Nest | 7.53% | 1.92%(+5.60)#48 | 1.67%(+5.85)#1,076 |
| 48. | Redkey | 7.30% | 1.92%(+5.38)#49 | 1.67%(+5.63)#1,126 |
| 49. | Alamo | 7.14% | 1.92%(+5.22)#50 | 1.67%(+5.47)#1,174 |
| 50. | Wall Lake | 6.79% | 1.92%(+4.86)#51 | 1.67%(+5.11)#1,272 |
| 51. | River Forest | 6.67% | 1.92%(+4.74)#52 | 1.67%(+4.99)#1,304 |
| 52. | Tyner | 6.57% | 1.92%(+4.65)#53 | 1.67%(+4.90)#1,328 |
| 53. | Orestes | 6.43% | 1.92%(+4.50)#54 | 1.67%(+4.75)#1,368 |
| 54. | Little York | 6.33% | 1.92%(+4.41)#55 | 1.67%(+4.66)#1,400 |
| 55. | Bruceville | 6.33% | 1.92%(+4.41)#56 | 1.67%(+4.65)#1,401 |
| 56. | Bloomfield | 6.12% | 1.92%(+4.19)#57 | 1.67%(+4.44)#1,485 |
| 57. | Larwill | 5.93% | 1.92%(+4.00)#58 | 1.67%(+4.25)#1,561 |
| 58. | Fishersburg | 5.88% | 1.92%(+3.96)#59 | 1.67%(+4.21)#1,584 |
| 59. | Middlebury | 5.87% | 1.92%(+3.95)#60 | 1.67%(+4.20)#1,586 |
| 60. | Denver | 5.87% | 1.92%(+3.95)#61 | 1.67%(+4.20)#1,587 |
| 61. | Loogootee | 5.84% | 1.92%(+3.92)#62 | 1.67%(+4.17)#1,598 |
| 62. | New Washington | 5.83% | 1.92%(+3.91)#63 | 1.67%(+4.16)#1,601 |
| 63. | Memphis | 5.66% | 1.92%(+3.73)#64 | 1.67%(+3.98)#1,689 |
| 64. | Pierceton | 5.65% | 1.92%(+3.73)#65 | 1.67%(+3.98)#1,691 |
| 65. | Servia | 5.56% | 1.92%(+3.63)#66 | 1.67%(+3.88)#1,744 |
| 66. | Vevay | 5.45% | 1.92%(+3.53)#67 | 1.67%(+3.78)#1,799 |
| 67. | Woodlawn Heights | 5.31% | 1.92%(+3.39)#68 | 1.67%(+3.64)#1,890 |
| 68. | Rockford | 5.12% | 1.92%(+3.20)#69 | 1.67%(+3.45)#2,006 |
| 69. | Milan | 5.10% | 1.92%(+3.17)#70 | 1.67%(+3.42)#2,019 |
| 70. | Newport | 5.02% | 1.92%(+3.09)#71 | 1.67%(+3.34)#2,065 |
| 71. | Upland | 5.00% | 1.92%(+3.07)#72 | 1.67%(+3.32)#2,079 |
| 72. | St Bernice | 4.99% | 1.92%(+3.07)#73 | 1.67%(+3.32)#2,084 |
| 73. | Sunman | 4.91% | 1.92%(+2.99)#74 | 1.67%(+3.24)#2,133 |
| 74. | Galena | 4.85% | 1.92%(+2.93)#75 | 1.67%(+3.17)#2,175 |
| 75. | New Palestine | 4.70% | 1.92%(+2.77)#76 | 1.67%(+3.02)#2,271 |
| 76. | Wynnedale | 4.59% | 1.92%(+2.66)#77 | 1.67%(+2.91)#2,351 |
| 77. | Leesburg | 4.56% | 1.92%(+2.64)#78 | 1.67%(+2.89)#2,367 |
| 78. | Amboy | 4.49% | 1.92%(+2.56)#79 | 1.67%(+2.81)#2,458 |
| 79. | Berne | 4.43% | 1.92%(+2.51)#80 | 1.67%(+2.76)#2,511 |
| 80. | Kingsbury | 4.41% | 1.92%(+2.48)#81 | 1.67%(+2.73)#2,531 |
| 81. | Homecroft | 4.34% | 1.92%(+2.42)#82 | 1.67%(+2.67)#2,596 |
| 82. | Clay City | 4.32% | 1.92%(+2.39)#83 | 1.67%(+2.64)#2,617 |
| 83. | Millersburg | 4.30% | 1.92%(+2.37)#84 | 1.67%(+2.62)#2,637 |
| 84. | Talma | 4.29% | 1.92%(+2.37)#85 | 1.67%(+2.62)#2,639 |
| 85. | Silver Lake | 4.26% | 1.92%(+2.33)#86 | 1.67%(+2.58)#2,670 |
| 86. | Whitestown | 4.23% | 1.92%(+2.31)#87 | 1.67%(+2.56)#2,702 |
| 87. | Charlottesville | 4.23% | 1.92%(+2.31)#88 | 1.67%(+2.56)#2,703 |
| 88. | Battle Ground | 4.20% | 1.92%(+2.27)#89 | 1.67%(+2.52)#2,738 |
| 89. | Matthews | 4.14% | 1.92%(+2.21)#90 | 1.67%(+2.46)#2,796 |
| 90. | Thorntown | 4.11% | 1.92%(+2.19)#91 | 1.67%(+2.44)#2,833 |
| 91. | Farmland | 4.01% | 1.92%(+2.08)#92 | 1.67%(+2.33)#2,949 |
| 92. | Shoals | 3.97% | 1.92%(+2.05)#93 | 1.67%(+2.30)#2,993 |
| 93. | Albany | 3.92% | 1.92%(+2.00)#94 | 1.67%(+2.25)#3,046 |
| 94. | Staunton | 3.82% | 1.92%(+1.89)#95 | 1.67%(+2.14)#3,194 |
| 95. | New Paris | 3.81% | 1.92%(+1.89)#96 | 1.67%(+2.14)#3,198 |
| 96. | Greendale | 3.76% | 1.92%(+1.83)#97 | 1.67%(+2.08)#3,283 |
| 97. | Eaton | 3.68% | 1.92%(+1.75)#98 | 1.67%(+2.00)#3,387 |
| 98. | Culver | 3.66% | 1.92%(+1.73)#99 | 1.67%(+1.98)#3,406 |
| 99. | Shorewood Forest | 3.64% | 1.92%(+1.72)#100 | 1.67%(+1.96)#3,433 |
| 100. | Jimmerson Lake | 3.55% | 1.92%(+1.63)#101 | 1.67%(+1.88)#3,556 |
Common Questions
What are the Top 10 Cities with the Highest Percentage of European Population in Indiana?
Top 10 Cities with the Highest Percentage of European Population in Indiana are:
#1
36.62%
#2
30.53%
#3
24.31%
#4
21.67%
#5
19.39%
#6
18.93%
#7
18.31%
#8
16.92%
#9
16.77%
#10
15.02%
What city has the Highest Percentage of European Population in Indiana?
North Crows Nest has the Highest Percentage of European Population in Indiana with 36.62%.
What is the Percentage of European Population in the State of Indiana?
Percentage of European Population in Indiana is 1.92%.
What is the Percentage of European Population in the United States?
Percentage of European Population in the United States is 1.67%.