Cities with the Most Births per 1,000 Women Below Poverty Level in Kentucky
RELATED REPORTS & OPTIONS
Highest Birth Rate | Below Poverty
Kentucky
Compare Cities
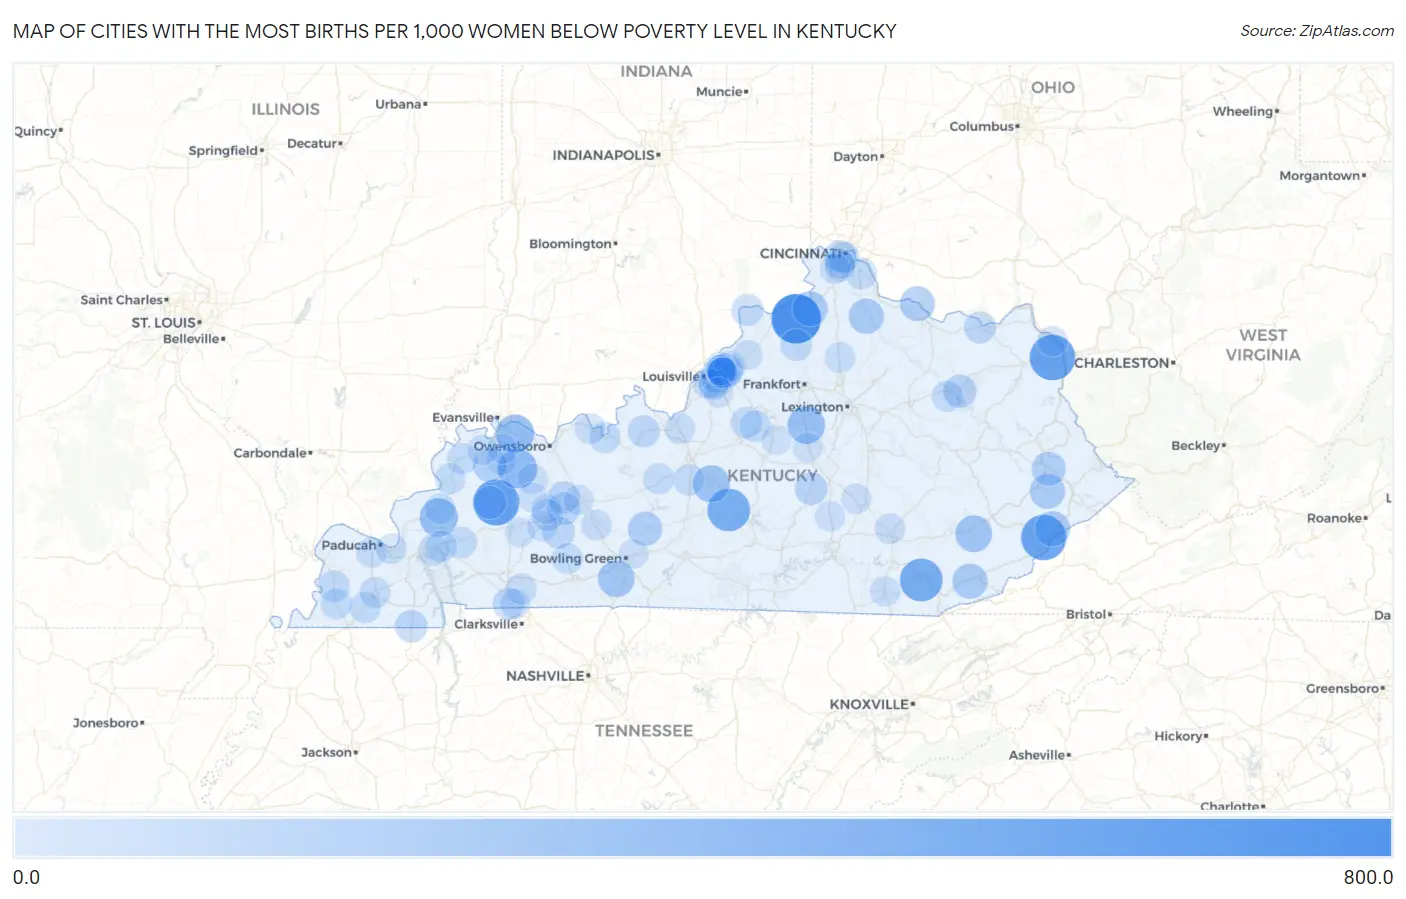
Map of Cities with the Most Births per 1,000 Women Below Poverty Level in Kentucky
0.0
800.0
Cities with the Most Births per 1,000 Women Below Poverty Level in Kentucky
| City | Births / 1,000 Women | vs State | vs National | |
| 1. | Sanders | 652.0 | 54.0(+598)#1 | 53.0(+599)#147 |
| 2. | Manitou | 545.0 | 54.0(+491)#2 | 53.0(+492)#205 |
| 3. | Cannonsburg | 535.0 | 54.0(+481)#3 | 53.0(+482)#210 |
| 4. | Mayking | 526.0 | 54.0(+472)#4 | 53.0(+473)#214 |
| 5. | Artemus | 453.0 | 54.0(+399)#5 | 53.0(+400)#274 |
| 6. | Summersville | 448.0 | 54.0(+394)#6 | 53.0(+395)#275 |
| 7. | Beech Grove | 354.0 | 54.0(+300)#7 | 53.0(+301)#438 |
| 8. | Spottsville | 325.0 | 54.0(+271)#8 | 53.0(+272)#526 |
| 9. | Crayne | 323.0 | 54.0(+269)#9 | 53.0(+270)#536 |
| 10. | Salvisa | 306.0 | 54.0(+252)#10 | 53.0(+253)#616 |
| 11. | Buffalo | 286.0 | 54.0(+232)#11 | 53.0(+233)#690 |
| 12. | Hyden | 279.0 | 54.0(+225)#12 | 53.0(+226)#731 |
| 13. | Woodburn | 273.0 | 54.0(+219)#13 | 53.0(+220)#755 |
| 14. | Creekside | 244.0 | 54.0(+190)#14 | 53.0(+191)#935 |
| 15. | Falmouth | 237.0 | 54.0(+183)#15 | 53.0(+184)#982 |
| 16. | Fleming Neon | 236.0 | 54.0(+182)#16 | 53.0(+183)#990 |
| 17. | Wallins Creek | 235.0 | 54.0(+181)#17 | 53.0(+182)#997 |
| 18. | Mcdowell | 233.0 | 54.0(+179)#18 | 53.0(+180)#1,010 |
| 19. | Glencoe | 232.0 | 54.0(+178)#19 | 53.0(+179)#1,022 |
| 20. | Dover | 228.0 | 54.0(+174)#20 | 53.0(+175)#1,062 |
| 21. | Brownsville | 206.0 | 54.0(+152)#21 | 53.0(+153)#1,278 |
| 22. | Allen | 205.0 | 54.0(+151)#22 | 53.0(+152)#1,294 |
| 23. | Poole | 200.0 | 54.0(+146)#23 | 53.0(+147)#1,350 |
| 24. | Richlawn | 177.0 | 54.0(+123)#24 | 53.0(+124)#1,668 |
| 25. | Lakeview Heights | 177.0 | 54.0(+123)#25 | 53.0(+124)#1,669 |
| 26. | Nebo | 171.0 | 54.0(+117)#26 | 53.0(+118)#1,788 |
| 27. | Hustonville | 167.0 | 54.0(+113)#27 | 53.0(+114)#1,852 |
| 28. | Westwood | 165.0 | 54.0(+111)#28 | 53.0(+112)#1,908 |
| 29. | Rockport | 164.0 | 54.0(+110)#29 | 53.0(+111)#1,932 |
| 30. | Centertown | 161.0 | 54.0(+107)#30 | 53.0(+108)#1,995 |
| 31. | Hazel | 159.0 | 54.0(+105)#31 | 53.0(+106)#2,035 |
| 32. | Philpot | 156.0 | 54.0(+102)#32 | 53.0(+103)#2,115 |
| 33. | Beechmont | 153.0 | 54.0(+99.0)#33 | 53.0(+100.0)#2,204 |
| 34. | Irvington | 148.0 | 54.0(+94.0)#34 | 53.0(+95.0)#2,343 |
| 35. | Fort Campbell North | 146.0 | 54.0(+92.0)#35 | 53.0(+93.0)#2,389 |
| 36. | Vanceburg | 146.0 | 54.0(+92.0)#36 | 53.0(+93.0)#2,398 |
| 37. | Bromley | 146.0 | 54.0(+92.0)#37 | 53.0(+93.0)#2,403 |
| 38. | Central City | 144.0 | 54.0(+90.0)#38 | 53.0(+91.0)#2,463 |
| 39. | Milton | 143.0 | 54.0(+89.0)#39 | 53.0(+90.0)#2,510 |
| 40. | Gratz | 143.0 | 54.0(+89.0)#40 | 53.0(+90.0)#2,549 |
| 41. | Rolling Hills | 139.0 | 54.0(+85.0)#41 | 53.0(+86.0)#2,673 |
| 42. | Arlington | 138.0 | 54.0(+84.0)#42 | 53.0(+85.0)#2,705 |
| 43. | Fairfield | 133.0 | 54.0(+79.0)#43 | 53.0(+80.0)#2,883 |
| 44. | Princeton | 132.0 | 54.0(+78.0)#44 | 53.0(+79.0)#2,895 |
| 45. | Eddyville | 132.0 | 54.0(+78.0)#45 | 53.0(+79.0)#2,902 |
| 46. | Bloomfield | 132.0 | 54.0(+78.0)#46 | 53.0(+79.0)#2,915 |
| 47. | Cloverport | 130.0 | 54.0(+76.0)#47 | 53.0(+77.0)#3,004 |
| 48. | Wingo | 129.0 | 54.0(+75.0)#48 | 53.0(+76.0)#3,055 |
| 49. | Alexandria | 126.0 | 54.0(+72.0)#49 | 53.0(+73.0)#3,164 |
| 50. | Salt Lick | 126.0 | 54.0(+72.0)#50 | 53.0(+73.0)#3,195 |
| 51. | Mayfield | 125.0 | 54.0(+71.0)#51 | 53.0(+72.0)#3,199 |
| 52. | Clinton | 124.0 | 54.0(+70.0)#52 | 53.0(+71.0)#3,280 |
| 53. | Sonora | 124.0 | 54.0(+70.0)#53 | 53.0(+71.0)#3,289 |
| 54. | Morganfield | 123.0 | 54.0(+69.0)#54 | 53.0(+70.0)#3,302 |
| 55. | Lewisburg | 121.0 | 54.0(+67.0)#55 | 53.0(+68.0)#3,418 |
| 56. | Park Hills | 120.0 | 54.0(+66.0)#56 | 53.0(+67.0)#3,453 |
| 57. | Big Clifty | 120.0 | 54.0(+66.0)#57 | 53.0(+67.0)#3,495 |
| 58. | Sturgis | 119.0 | 54.0(+65.0)#58 | 53.0(+66.0)#3,522 |
| 59. | Wellington | 118.0 | 54.0(+64.0)#59 | 53.0(+65.0)#3,607 |
| 60. | Kuttawa | 116.0 | 54.0(+62.0)#60 | 53.0(+63.0)#3,710 |
| 61. | Sadieville | 116.0 | 54.0(+62.0)#61 | 53.0(+63.0)#3,718 |
| 62. | Marion | 115.0 | 54.0(+61.0)#62 | 53.0(+62.0)#3,747 |
| 63. | Pembroke | 115.0 | 54.0(+61.0)#63 | 53.0(+62.0)#3,768 |
| 64. | Green Spring | 115.0 | 54.0(+61.0)#64 | 53.0(+62.0)#3,774 |
| 65. | Orchard Grass Hills | 114.0 | 54.0(+60.0)#65 | 53.0(+61.0)#3,815 |
| 66. | Morgantown | 111.0 | 54.0(+57.0)#66 | 53.0(+58.0)#3,978 |
| 67. | Fort Knox | 110.0 | 54.0(+56.0)#67 | 53.0(+57.0)#4,061 |
| 68. | Massac | 110.0 | 54.0(+56.0)#68 | 53.0(+57.0)#4,068 |
| 69. | Edgewood | 109.0 | 54.0(+55.0)#69 | 53.0(+56.0)#4,119 |
| 70. | East Bernstadt | 109.0 | 54.0(+55.0)#70 | 53.0(+56.0)#4,154 |
| 71. | Hawesville | 108.0 | 54.0(+54.0)#71 | 53.0(+55.0)#4,199 |
| 72. | Elsmere | 107.0 | 54.0(+53.0)#72 | 53.0(+54.0)#4,230 |
| 73. | Ledbetter | 107.0 | 54.0(+53.0)#73 | 53.0(+54.0)#4,252 |
| 74. | Bellefonte | 107.0 | 54.0(+53.0)#74 | 53.0(+54.0)#4,266 |
| 75. | Williamsburg | 104.0 | 54.0(+50.0)#75 | 53.0(+51.0)#4,439 |
| 76. | West Buechel | 104.0 | 54.0(+50.0)#76 | 53.0(+51.0)#4,459 |
| 77. | Audubon Park | 104.0 | 54.0(+50.0)#77 | 53.0(+51.0)#4,465 |
| 78. | Greenville | 103.0 | 54.0(+49.0)#78 | 53.0(+50.0)#4,503 |
| 79. | Brodhead | 103.0 | 54.0(+49.0)#79 | 53.0(+50.0)#4,526 |
| 80. | Oak Grove | 102.0 | 54.0(+48.0)#80 | 53.0(+49.0)#4,575 |
| 81. | Sorgho | 102.0 | 54.0(+48.0)#81 | 53.0(+49.0)#4,592 |
| 82. | Robards | 102.0 | 54.0(+48.0)#82 | 53.0(+49.0)#4,627 |
| 83. | Eubank | 102.0 | 54.0(+48.0)#83 | 53.0(+49.0)#4,632 |
| 84. | Barbourmeade | 101.0 | 54.0(+47.0)#84 | 53.0(+48.0)#4,696 |
| 85. | Spring Valley | 101.0 | 54.0(+47.0)#85 | 53.0(+48.0)#4,702 |
| 86. | Corydon | 101.0 | 54.0(+47.0)#86 | 53.0(+48.0)#4,704 |
| 87. | Plantation | 99.0 | 54.0(+45.0)#87 | 53.0(+46.0)#4,878 |
| 88. | La Grange | 98.0 | 54.0(+44.0)#88 | 53.0(+45.0)#4,907 |
| 89. | White Plains | 96.0 | 54.0(+42.0)#89 | 53.0(+43.0)#5,134 |
| 90. | Anthoston | 96.0 | 54.0(+42.0)#90 | 53.0(+43.0)#5,163 |
| 91. | Crestview Hills | 95.0 | 54.0(+41.0)#91 | 53.0(+42.0)#5,198 |
| 92. | Calhoun | 95.0 | 54.0(+41.0)#92 | 53.0(+42.0)#5,234 |
| 93. | Sacramento | 95.0 | 54.0(+41.0)#93 | 53.0(+42.0)#5,248 |
| 94. | Briarwood | 95.0 | 54.0(+41.0)#94 | 53.0(+42.0)#5,251 |
| 95. | South Carrollton | 95.0 | 54.0(+41.0)#95 | 53.0(+42.0)#5,261 |
| 96. | Beaver Dam | 94.0 | 54.0(+40.0)#96 | 53.0(+41.0)#5,296 |
| 97. | Plum Springs | 94.0 | 54.0(+40.0)#97 | 53.0(+41.0)#5,327 |
| 98. | Willisburg | 94.0 | 54.0(+40.0)#98 | 53.0(+41.0)#5,330 |
| 99. | Spring Mill | 94.0 | 54.0(+40.0)#99 | 53.0(+41.0)#5,332 |
| 100. | Harrodsburg | 93.0 | 54.0(+39.0)#100 | 53.0(+40.0)#5,352 |
Common Questions
What are the Top 10 Cities with the Most Births per 1,000 Women Below Poverty Level in Kentucky?
Top 10 Cities with the Most Births per 1,000 Women Below Poverty Level in Kentucky are:
#1
652.0
#2
545.0
#3
535.0
#4
526.0
#5
453.0
#6
448.0
#7
354.0
#8
325.0
#9
323.0
#10
306.0
What city has the Most Births per 1,000 Women Below Poverty Level in Kentucky?
Sanders has the Most Births per 1,000 Women Below Poverty Level in Kentucky with 652.0.
What is the Number of Births per 1,000 Women Below Poverty Level in the State of Kentucky?
Number of Births per 1,000 Women Below Poverty Level in Kentucky is 54.0.
What is the Number of Births per 1,000 Women Below Poverty Level in the United States?
Number of Births per 1,000 Women Below Poverty Level in the United States is 53.0.