Cities with the Most Births per 1,000 Women Below Poverty Level in Vermont
RELATED REPORTS & OPTIONS
Highest Birth Rate | Below Poverty
Vermont
Compare Cities
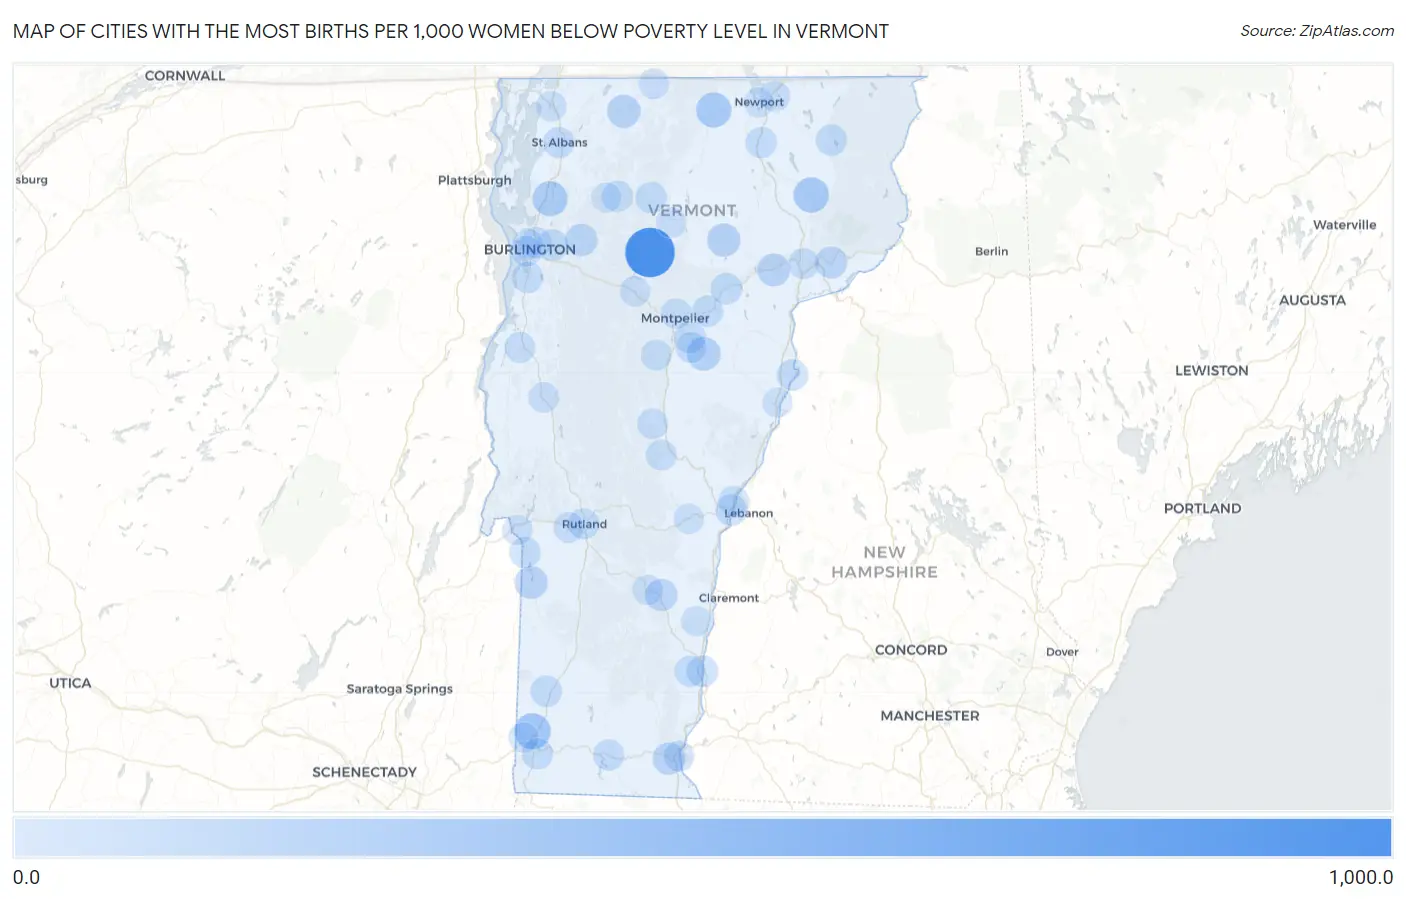
Map of Cities with the Most Births per 1,000 Women Below Poverty Level in Vermont
0.0
1,000.0
Cities with the Most Births per 1,000 Women Below Poverty Level in Vermont
| City | Births / 1,000 Women | vs State | vs National | |
| 1. | Stowe | 1,000.0 | 45.0(+955)#1 | 53.0(+947)#4 |
| 2. | Whitingham | 500.0 | 45.0(+455)#2 | 53.0(+447)#233 |
| 3. | Killington | 406.0 | 45.0(+361)#3 | 53.0(+353)#341 |
| 4. | South Shaftsbury | 310.0 | 45.0(+265)#4 | 53.0(+257)#590 |
| 5. | West Burke | 258.0 | 45.0(+213)#5 | 53.0(+205)#841 |
| 6. | Underhill Flats | 254.0 | 45.0(+209)#6 | 53.0(+201)#861 |
| 7. | Westford | 250.0 | 45.0(+205)#7 | 53.0(+197)#884 |
| 8. | Troy | 250.0 | 45.0(+205)#8 | 53.0(+197)#889 |
| 9. | Milton | 243.0 | 45.0(+198)#9 | 53.0(+190)#942 |
| 10. | West Charlotte | 240.0 | 45.0(+195)#10 | 53.0(+187)#960 |
| 11. | Middletown Springs | 235.0 | 45.0(+190)#11 | 53.0(+182)#1,004 |
| 12. | Pawlet | 216.0 | 45.0(+171)#12 | 53.0(+163)#1,172 |
| 13. | East Barre | 182.0 | 45.0(+137)#13 | 53.0(+129)#1,581 |
| 14. | Hardwick | 161.0 | 45.0(+116)#14 | 53.0(+108)#1,988 |
| 15. | Enosburg Falls | 154.0 | 45.0(+109)#15 | 53.0(+101)#2,157 |
| 16. | Wells | 137.0 | 45.0(+92.0)#16 | 53.0(+84.0)#2,738 |
| 17. | Danville | 134.0 | 45.0(+89.0)#17 | 53.0(+81.0)#2,834 |
| 18. | Jericho | 121.0 | 45.0(+76.0)#18 | 53.0(+68.0)#3,417 |
| 19. | West Brattleboro | 119.0 | 45.0(+74.0)#19 | 53.0(+66.0)#3,519 |
| 20. | Proctorsville | 110.0 | 45.0(+65.0)#20 | 53.0(+57.0)#4,108 |
| 21. | Danby | 107.0 | 45.0(+62.0)#21 | 53.0(+54.0)#4,293 |
| 22. | Concord | 104.0 | 45.0(+59.0)#22 | 53.0(+51.0)#4,489 |
| 23. | Chittenden | 88.0 | 45.0(+43.0)#23 | 53.0(+35.0)#5,905 |
| 24. | Arlington | 82.0 | 45.0(+37.0)#24 | 53.0(+29.0)#6,529 |
| 25. | Barre | 80.0 | 45.0(+35.0)#25 | 53.0(+27.0)#6,740 |
| 26. | Stamford | 79.0 | 45.0(+34.0)#26 | 53.0(+26.0)#6,946 |
| 27. | Essex Junction | 78.0 | 45.0(+33.0)#27 | 53.0(+25.0)#6,981 |
| 28. | Johnson | 76.0 | 45.0(+31.0)#28 | 53.0(+23.0)#7,323 |
| 29. | Bellows Falls | 74.0 | 45.0(+29.0)#29 | 53.0(+21.0)#7,579 |
| 30. | Plainfield | 73.0 | 45.0(+28.0)#30 | 53.0(+20.0)#7,797 |
| 31. | Newbury | 73.0 | 45.0(+28.0)#31 | 53.0(+20.0)#7,798 |
| 32. | Island Pond | 72.0 | 45.0(+27.0)#32 | 53.0(+19.0)#7,914 |
| 33. | Marshfield | 72.0 | 45.0(+27.0)#33 | 53.0(+19.0)#7,925 |
| 34. | White River Junction | 70.0 | 45.0(+25.0)#34 | 53.0(+17.0)#8,195 |
| 35. | Shelburne | 66.0 | 45.0(+21.0)#35 | 53.0(+13.0)#8,854 |
| 36. | Saxtons River | 66.0 | 45.0(+21.0)#36 | 53.0(+13.0)#8,926 |
| 37. | Jeffersonville | 63.0 | 45.0(+18.0)#37 | 53.0(+10.00)#9,492 |
| 38. | Bennington | 62.0 | 45.0(+17.0)#38 | 53.0(+9.00)#9,635 |
| 39. | St Albans | 60.0 | 45.0(+15.0)#39 | 53.0(+7.00)#10,002 |
| 40. | Orleans | 60.0 | 45.0(+15.0)#40 | 53.0(+7.00)#10,067 |
| 41. | Poultney | 58.0 | 45.0(+13.0)#41 | 53.0(+5.00)#10,491 |
| 42. | Proctor | 54.0 | 45.0(+9.00)#42 | 53.0(+1.000)#11,380 |
| 43. | Rutland | 52.0 | 45.0(+7.00)#43 | 53.0(-1.000)#11,742 |
| 44. | Castleton Four Corners | 51.0 | 45.0(+6.00)#44 | 53.0(-2.00)#12,097 |
| 45. | Wilmington | 51.0 | 45.0(+6.00)#45 | 53.0(-2.00)#12,121 |
| 46. | South Barre | 50.0 | 45.0(+5.00)#46 | 53.0(-3.00)#12,335 |
| 47. | Winooski | 47.0 | 45.0(+2.00)#47 | 53.0(-6.00)#12,983 |
| 48. | Northfield | 46.0 | 45.0(+1.000)#48 | 53.0(-7.00)#13,254 |
| 49. | Vergennes | 46.0 | 45.0(+1.000)#49 | 53.0(-7.00)#13,276 |
| 50. | Pownal Center | 42.0 | 45.0(-3.00)#50 | 53.0(-11.0)#14,320 |
| 51. | Derby Center | 41.0 | 45.0(-4.00)#51 | 53.0(-12.0)#14,558 |
| 52. | Brattleboro | 40.0 | 45.0(-5.00)#52 | 53.0(-13.0)#14,664 |
| 53. | Randolph | 40.0 | 45.0(-5.00)#53 | 53.0(-13.0)#14,728 |
| 54. | St Johnsbury | 39.0 | 45.0(-6.00)#54 | 53.0(-14.0)#14,919 |
| 55. | West Rutland | 38.0 | 45.0(-7.00)#55 | 53.0(-15.0)#15,200 |
| 56. | Wilder | 37.0 | 45.0(-8.00)#56 | 53.0(-16.0)#15,446 |
| 57. | Middlebury | 36.0 | 45.0(-9.00)#57 | 53.0(-17.0)#15,641 |
| 58. | Montpelier | 35.0 | 45.0(-10.00)#58 | 53.0(-18.0)#15,869 |
| 59. | Bethel | 34.0 | 45.0(-11.0)#59 | 53.0(-19.0)#16,231 |
| 60. | Burlington | 33.0 | 45.0(-12.0)#60 | 53.0(-20.0)#16,280 |
| 61. | South Burlington | 31.0 | 45.0(-14.0)#61 | 53.0(-22.0)#16,748 |
| 62. | Richford | 31.0 | 45.0(-14.0)#62 | 53.0(-22.0)#16,868 |
| 63. | Morrisville | 27.0 | 45.0(-18.0)#63 | 53.0(-26.0)#17,711 |
| 64. | Fair Haven | 25.0 | 45.0(-20.0)#64 | 53.0(-28.0)#18,098 |
| 65. | Ludlow | 25.0 | 45.0(-20.0)#65 | 53.0(-28.0)#18,174 |
| 66. | Waterbury | 24.0 | 45.0(-21.0)#66 | 53.0(-29.0)#18,322 |
| 67. | Huntington | 23.0 | 45.0(-22.0)#67 | 53.0(-30.0)#18,575 |
| 68. | Woodstock | 21.0 | 45.0(-24.0)#68 | 53.0(-32.0)#18,917 |
| 69. | Springfield | 20.0 | 45.0(-25.0)#69 | 53.0(-33.0)#19,027 |
| 70. | Swanton | 20.0 | 45.0(-25.0)#70 | 53.0(-33.0)#19,056 |
| 71. | Newport | 16.0 | 45.0(-29.0)#71 | 53.0(-37.0)#19,696 |
| 72. | Cambridge | 16.0 | 45.0(-29.0)#72 | 53.0(-37.0)#19,826 |
| 73. | North Bennington | 14.0 | 45.0(-31.0)#73 | 53.0(-39.0)#20,063 |
| 74. | St. George | 12.0 | 45.0(-33.0)#74 | 53.0(-41.0)#20,382 |
| 75. | Bradford | 9.0 | 45.0(-36.0)#75 | 53.0(-44.0)#20,685 |
1
Common Questions
What are the Top 10 Cities with the Most Births per 1,000 Women Below Poverty Level in Vermont?
Top 10 Cities with the Most Births per 1,000 Women Below Poverty Level in Vermont are:
#1
1,000.0
#2
310.0
#3
258.0
#4
250.0
#5
243.0
#6
182.0
#7
161.0
#8
154.0
#9
137.0
#10
134.0
What city has the Most Births per 1,000 Women Below Poverty Level in Vermont?
Stowe has the Most Births per 1,000 Women Below Poverty Level in Vermont with 1,000.0.
What is the Number of Births per 1,000 Women Below Poverty Level in the State of Vermont?
Number of Births per 1,000 Women Below Poverty Level in Vermont is 45.0.
What is the Number of Births per 1,000 Women Below Poverty Level in the United States?
Number of Births per 1,000 Women Below Poverty Level in the United States is 53.0.