Cities with the Most Births per 1,000 Women Below Poverty Level in New Mexico
RELATED REPORTS & OPTIONS
Highest Birth Rate | Below Poverty
New Mexico
Compare Cities
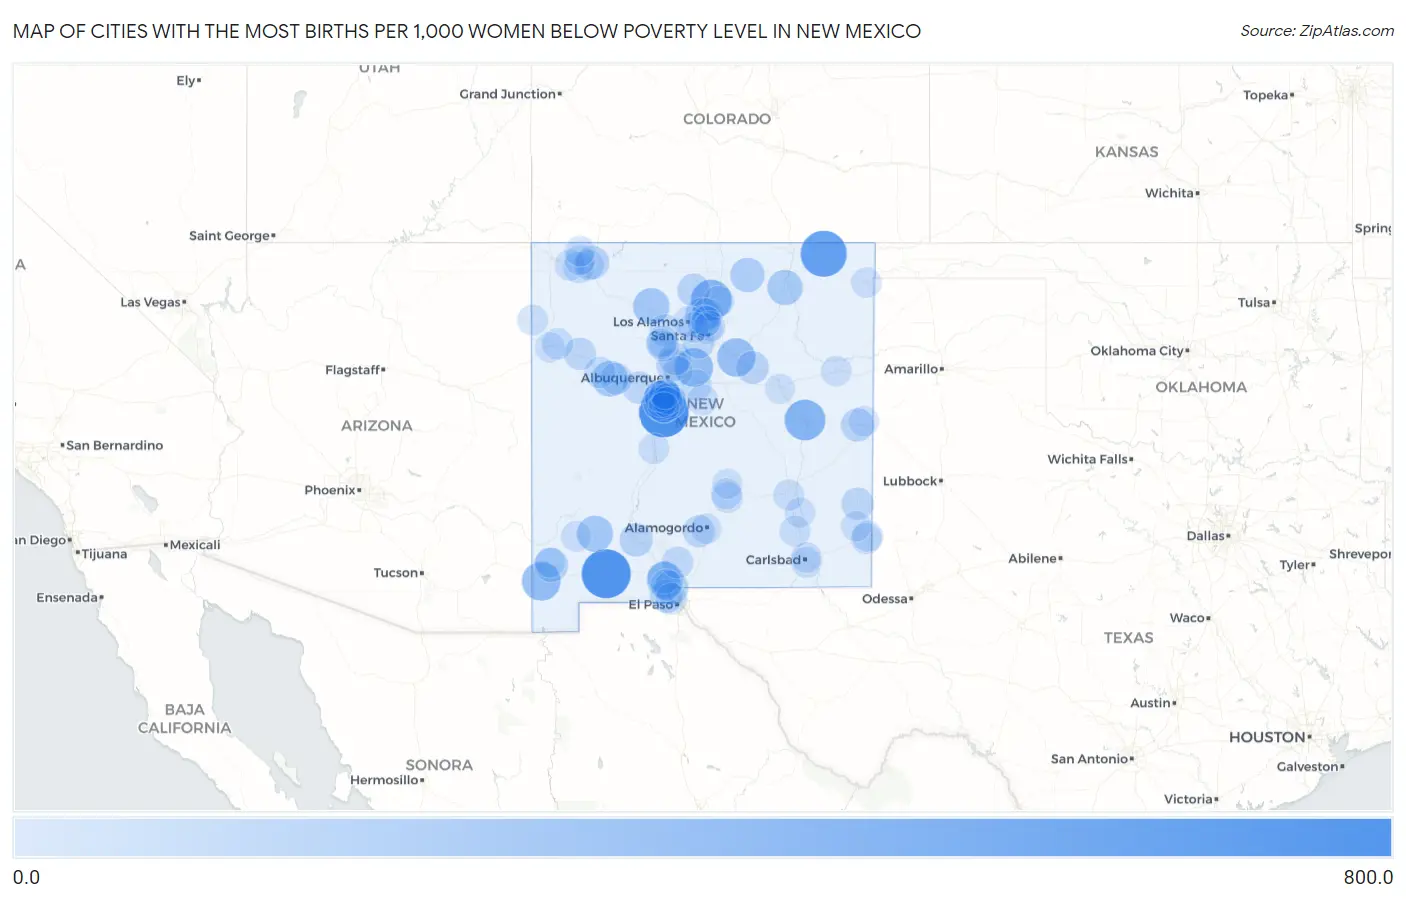
Map of Cities with the Most Births per 1,000 Women Below Poverty Level in New Mexico
0.0
800.0
Cities with the Most Births per 1,000 Women Below Poverty Level in New Mexico
| City | Births / 1,000 Women | vs State | vs National | |
| 1. | Madrone | 750.0 | 55.0(+695)#1 | 53.0(+697)#109 |
| 2. | La Hacienda | 730.0 | 55.0(+675)#2 | 53.0(+677)#122 |
| 3. | Folsom | 625.0 | 55.0(+570)#3 | 53.0(+572)#164 |
| 4. | Tome | 477.0 | 55.0(+422)#4 | 53.0(+424)#257 |
| 5. | Fort Sumner | 430.0 | 55.0(+375)#5 | 53.0(+377)#294 |
| 6. | Dixon | 429.0 | 55.0(+374)#6 | 53.0(+376)#295 |
| 7. | Cotton City | 356.0 | 55.0(+301)#7 | 53.0(+303)#434 |
| 8. | San Pedro | 353.0 | 55.0(+298)#8 | 53.0(+300)#441 |
| 9. | Williams Acres | 346.0 | 55.0(+291)#9 | 53.0(+293)#453 |
| 10. | Ribera | 339.0 | 55.0(+284)#10 | 53.0(+286)#472 |
| 11. | Tortugas | 318.0 | 55.0(+263)#11 | 53.0(+265)#554 |
| 12. | Monterey Park | 313.0 | 55.0(+258)#12 | 53.0(+260)#579 |
| 13. | Hyde Park | 288.0 | 55.0(+233)#13 | 53.0(+235)#683 |
| 14. | La Mesa | 273.0 | 55.0(+218)#14 | 53.0(+220)#753 |
| 15. | La Jara | 271.0 | 55.0(+216)#15 | 53.0(+218)#765 |
| 16. | San Lorenzo | 265.0 | 55.0(+210)#16 | 53.0(+212)#800 |
| 17. | Mccartys Village | 253.0 | 55.0(+198)#17 | 53.0(+200)#866 |
| 18. | Springer | 236.0 | 55.0(+181)#18 | 53.0(+183)#989 |
| 19. | Sombrillo | 214.0 | 55.0(+159)#19 | 53.0(+161)#1,199 |
| 20. | Eagle Nest | 205.0 | 55.0(+150)#20 | 53.0(+152)#1,293 |
| 21. | El Cerro | 197.0 | 55.0(+142)#21 | 53.0(+144)#1,380 |
| 22. | Lordsburg | 188.0 | 55.0(+133)#22 | 53.0(+135)#1,491 |
| 23. | Anthony | 186.0 | 55.0(+131)#23 | 53.0(+133)#1,521 |
| 24. | Crouch Mesa | 171.0 | 55.0(+116)#24 | 53.0(+118)#1,772 |
| 25. | Salem | 170.0 | 55.0(+115)#25 | 53.0(+117)#1,796 |
| 26. | Torreon Cdp Sandoval County | 169.0 | 55.0(+114)#26 | 53.0(+116)#1,811 |
| 27. | Valencia | 167.0 | 55.0(+112)#27 | 53.0(+114)#1,842 |
| 28. | Bloomfield | 166.0 | 55.0(+111)#28 | 53.0(+113)#1,888 |
| 29. | Cannon Afb | 161.0 | 55.0(+106)#29 | 53.0(+108)#1,982 |
| 30. | El Rito | 156.0 | 55.0(+101)#30 | 53.0(+103)#2,114 |
| 31. | Santa Teresa | 150.0 | 55.0(+95.0)#31 | 53.0(+97.0)#2,266 |
| 32. | Tecolotito | 150.0 | 55.0(+95.0)#32 | 53.0(+97.0)#2,281 |
| 33. | Pojoaque | 148.0 | 55.0(+93.0)#33 | 53.0(+95.0)#2,335 |
| 34. | Pueblo Of Sandia Village | 148.0 | 55.0(+93.0)#34 | 53.0(+95.0)#2,349 |
| 35. | San Miguel | 147.0 | 55.0(+92.0)#35 | 53.0(+94.0)#2,378 |
| 36. | Santa Ana Pueblo | 142.0 | 55.0(+87.0)#36 | 53.0(+89.0)#2,581 |
| 37. | Belen | 134.0 | 55.0(+79.0)#37 | 53.0(+81.0)#2,810 |
| 38. | San Jose Cdp Rio Arriba County | 133.0 | 55.0(+78.0)#38 | 53.0(+80.0)#2,872 |
| 39. | Tatum | 133.0 | 55.0(+78.0)#39 | 53.0(+80.0)#2,873 |
| 40. | Highland Meadows | 133.0 | 55.0(+78.0)#40 | 53.0(+80.0)#2,879 |
| 41. | Thoreau | 131.0 | 55.0(+76.0)#41 | 53.0(+78.0)#2,958 |
| 42. | Holloman Afb | 127.0 | 55.0(+72.0)#42 | 53.0(+74.0)#3,128 |
| 43. | La Cienega | 125.0 | 55.0(+70.0)#43 | 53.0(+72.0)#3,208 |
| 44. | Los Chaves | 121.0 | 55.0(+66.0)#44 | 53.0(+68.0)#3,399 |
| 45. | Rio Rancho Estates | 118.0 | 55.0(+63.0)#45 | 53.0(+65.0)#3,584 |
| 46. | North Acomita Village | 116.0 | 55.0(+61.0)#46 | 53.0(+63.0)#3,722 |
| 47. | White Sands | 115.0 | 55.0(+60.0)#47 | 53.0(+62.0)#3,756 |
| 48. | Valle Vista | 115.0 | 55.0(+60.0)#48 | 53.0(+62.0)#3,769 |
| 49. | Sunland Park | 107.0 | 55.0(+52.0)#49 | 53.0(+54.0)#4,227 |
| 50. | Jemez Springs | 105.0 | 55.0(+50.0)#50 | 53.0(+52.0)#4,411 |
| 51. | Kirtland Afb | 102.0 | 55.0(+47.0)#51 | 53.0(+49.0)#4,585 |
| 52. | Grants | 101.0 | 55.0(+46.0)#52 | 53.0(+48.0)#4,652 |
| 53. | Chamberino | 101.0 | 55.0(+46.0)#53 | 53.0(+48.0)#4,706 |
| 54. | Napi Headquarters | 98.0 | 55.0(+43.0)#54 | 53.0(+45.0)#4,948 |
| 55. | Indian Hills | 96.0 | 55.0(+41.0)#55 | 53.0(+43.0)#5,129 |
| 56. | Jemez Pueblo | 92.0 | 55.0(+37.0)#56 | 53.0(+39.0)#5,479 |
| 57. | Church Rock | 92.0 | 55.0(+37.0)#57 | 53.0(+39.0)#5,488 |
| 58. | Los Lunas | 91.0 | 55.0(+36.0)#58 | 53.0(+38.0)#5,529 |
| 59. | Ojo Amarillo | 88.0 | 55.0(+33.0)#59 | 53.0(+35.0)#5,890 |
| 60. | El Cerro Mission | 86.0 | 55.0(+31.0)#60 | 53.0(+33.0)#6,048 |
| 61. | Chimayo | 86.0 | 55.0(+31.0)#61 | 53.0(+33.0)#6,057 |
| 62. | Roswell | 85.0 | 55.0(+30.0)#62 | 53.0(+32.0)#6,110 |
| 63. | Hobbs | 84.0 | 55.0(+29.0)#63 | 53.0(+31.0)#6,209 |
| 64. | North Hobbs | 84.0 | 55.0(+29.0)#64 | 53.0(+31.0)#6,236 |
| 65. | Ruidoso Downs | 84.0 | 55.0(+29.0)#65 | 53.0(+31.0)#6,260 |
| 66. | West Hammond | 84.0 | 55.0(+29.0)#66 | 53.0(+31.0)#6,263 |
| 67. | Zia Pueblo | 84.0 | 55.0(+29.0)#67 | 53.0(+31.0)#6,296 |
| 68. | Navajo | 83.0 | 55.0(+28.0)#68 | 53.0(+30.0)#6,371 |
| 69. | Sundance | 83.0 | 55.0(+28.0)#69 | 53.0(+30.0)#6,415 |
| 70. | Chamisal | 83.0 | 55.0(+28.0)#70 | 53.0(+30.0)#6,425 |
| 71. | Estancia | 82.0 | 55.0(+27.0)#71 | 53.0(+29.0)#6,533 |
| 72. | Farmington | 81.0 | 55.0(+26.0)#72 | 53.0(+28.0)#6,593 |
| 73. | Socorro | 81.0 | 55.0(+26.0)#73 | 53.0(+28.0)#6,613 |
| 74. | Las Maravillas | 81.0 | 55.0(+26.0)#74 | 53.0(+28.0)#6,654 |
| 75. | Peak Place | 81.0 | 55.0(+26.0)#75 | 53.0(+28.0)#6,689 |
| 76. | Artesia | 80.0 | 55.0(+25.0)#76 | 53.0(+27.0)#6,730 |
| 77. | Ruidoso | 80.0 | 55.0(+25.0)#77 | 53.0(+27.0)#6,742 |
| 78. | Carlsbad | 79.0 | 55.0(+24.0)#78 | 53.0(+26.0)#6,850 |
| 79. | Los Alamos | 76.0 | 55.0(+21.0)#79 | 53.0(+23.0)#7,260 |
| 80. | La Huerta | 76.0 | 55.0(+21.0)#80 | 53.0(+23.0)#7,327 |
| 81. | Clovis | 75.0 | 55.0(+20.0)#81 | 53.0(+22.0)#7,350 |
| 82. | Silver City | 74.0 | 55.0(+19.0)#82 | 53.0(+21.0)#7,532 |
| 83. | Tucumcari | 74.0 | 55.0(+19.0)#83 | 53.0(+21.0)#7,551 |
| 84. | Bosque Farms | 73.0 | 55.0(+18.0)#84 | 53.0(+20.0)#7,730 |
| 85. | La Plata | 73.0 | 55.0(+18.0)#85 | 53.0(+20.0)#7,754 |
| 86. | Clayton | 72.0 | 55.0(+17.0)#86 | 53.0(+19.0)#7,888 |
| 87. | Chupadero | 72.0 | 55.0(+17.0)#87 | 53.0(+19.0)#7,932 |
| 88. | Lovington | 71.0 | 55.0(+16.0)#88 | 53.0(+18.0)#7,972 |
| 89. | White Rock | 70.0 | 55.0(+15.0)#89 | 53.0(+17.0)#8,178 |
| 90. | Alamogordo | 69.0 | 55.0(+14.0)#90 | 53.0(+16.0)#8,271 |
| 91. | San Ysidro | 69.0 | 55.0(+14.0)#91 | 53.0(+16.0)#8,420 |
| 92. | Rio Communities | 68.0 | 55.0(+13.0)#92 | 53.0(+15.0)#8,498 |
| 93. | Placitas Cdp Sandoval County | 68.0 | 55.0(+13.0)#93 | 53.0(+15.0)#8,506 |
| 94. | Hagerman | 68.0 | 55.0(+13.0)#94 | 53.0(+15.0)#8,557 |
| 95. | Nambe | 67.0 | 55.0(+12.0)#95 | 53.0(+14.0)#8,705 |
| 96. | Gallup | 65.0 | 55.0(+10.00)#96 | 53.0(+12.0)#8,974 |
| 97. | Glen Acres | 65.0 | 55.0(+10.00)#97 | 53.0(+12.0)#9,116 |
| 98. | Sandia Heights | 63.0 | 55.0(+8.00)#98 | 53.0(+10.00)#9,421 |
| 99. | Capitan | 63.0 | 55.0(+8.00)#99 | 53.0(+10.00)#9,462 |
| 100. | Santa Rosa | 61.0 | 55.0(+6.00)#100 | 53.0(+8.00)#9,825 |
1
2Common Questions
What are the Top 10 Cities with the Most Births per 1,000 Women Below Poverty Level in New Mexico?
Top 10 Cities with the Most Births per 1,000 Women Below Poverty Level in New Mexico are:
#1
750.0
#2
730.0
#3
625.0
#4
477.0
#5
430.0
#6
429.0
#7
356.0
#8
353.0
#9
339.0
#10
313.0
What city has the Most Births per 1,000 Women Below Poverty Level in New Mexico?
Madrone has the Most Births per 1,000 Women Below Poverty Level in New Mexico with 750.0.
What is the Number of Births per 1,000 Women Below Poverty Level in the State of New Mexico?
Number of Births per 1,000 Women Below Poverty Level in New Mexico is 55.0.
What is the Number of Births per 1,000 Women Below Poverty Level in the United States?
Number of Births per 1,000 Women Below Poverty Level in the United States is 53.0.