Cities with the Largest Spanish Community in Kentucky
RELATED REPORTS & OPTIONS
Spanish
Kentucky
Compare Cities
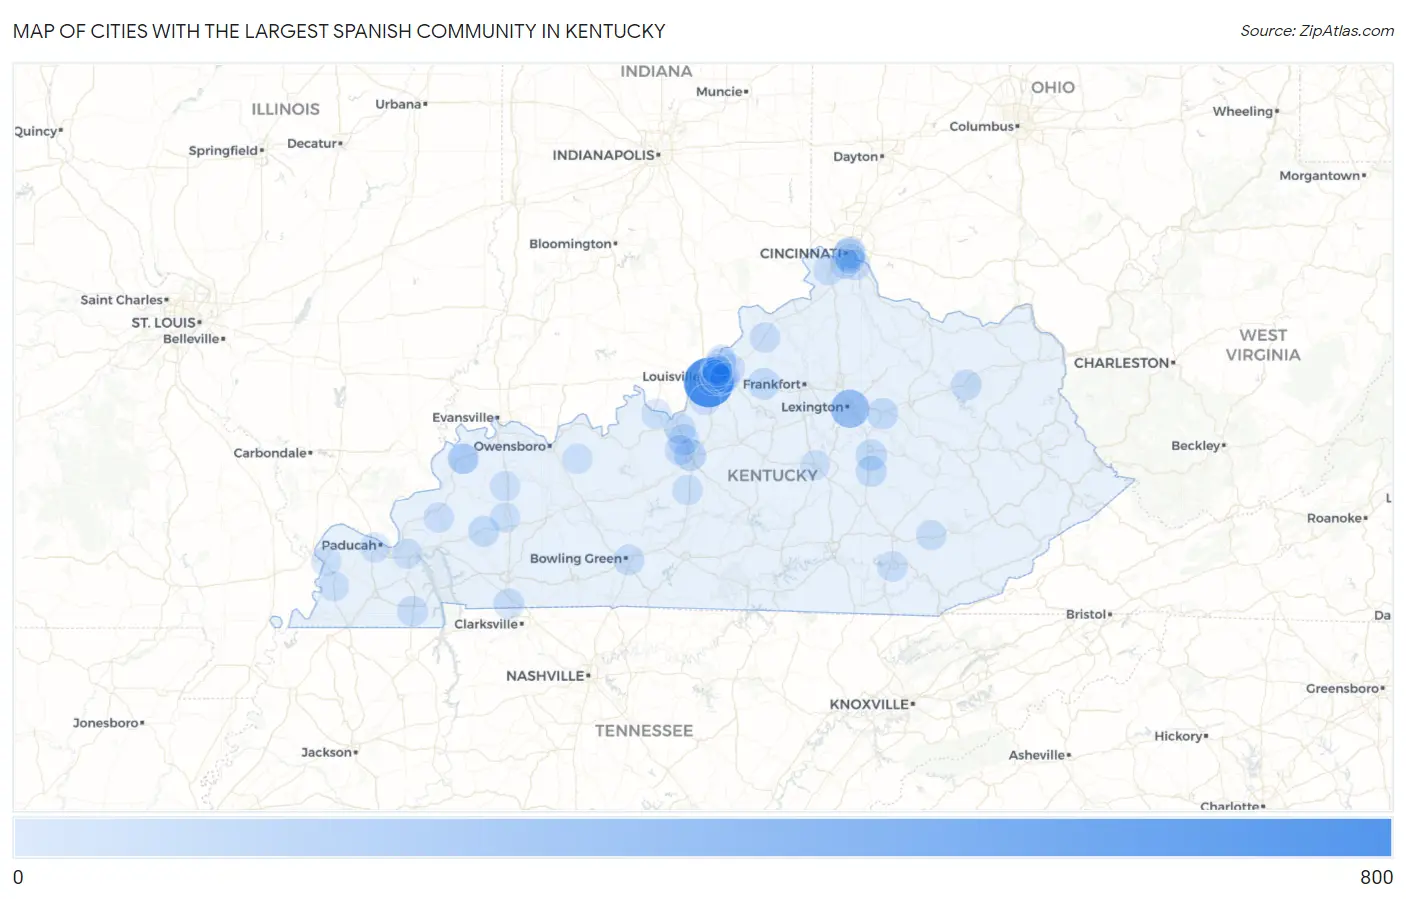
Map of Cities with the Largest Spanish Community in Kentucky
0
800
Cities with the Largest Spanish Community in Kentucky
| City | Spanish | vs State | vs National | |
| 1. | Louisville | 655 | 2,559(25.60%)#1 | 776,448(0.08%)#136 |
| 2. | Lexington | 267 | 2,559(10.43%)#2 | 776,448(0.03%)#468 |
| 3. | Elizabethtown | 68 | 2,559(2.66%)#3 | 776,448(0.01%)#1,699 |
| 4. | Newport | 68 | 2,559(2.66%)#4 | 776,448(0.01%)#1,705 |
| 5. | Bellevue | 49 | 2,559(1.91%)#5 | 776,448(0.01%)#2,142 |
| 6. | Shelbyville | 48 | 2,559(1.88%)#6 | 776,448(0.01%)#2,162 |
| 7. | Winchester | 41 | 2,559(1.60%)#7 | 776,448(0.01%)#2,381 |
| 8. | Richmond | 40 | 2,559(1.56%)#8 | 776,448(0.01%)#2,409 |
| 9. | Berea | 37 | 2,559(1.45%)#9 | 776,448(0.00%)#2,530 |
| 10. | Radcliff | 36 | 2,559(1.41%)#10 | 776,448(0.00%)#2,559 |
| 11. | Dawson Springs | 31 | 2,559(1.21%)#11 | 776,448(0.00%)#2,843 |
| 12. | Fort Knox | 27 | 2,559(1.06%)#12 | 776,448(0.00%)#3,020 |
| 13. | Bowling Green | 26 | 2,559(1.02%)#13 | 776,448(0.00%)#3,054 |
| 14. | Fort Campbell North | 22 | 2,559(0.86%)#14 | 776,448(0.00%)#3,308 |
| 15. | Murray | 21 | 2,559(0.82%)#15 | 776,448(0.00%)#3,358 |
| 16. | Morehead | 21 | 2,559(0.82%)#16 | 776,448(0.00%)#3,378 |
| 17. | Cold Spring | 20 | 2,559(0.78%)#17 | 776,448(0.00%)#3,468 |
| 18. | Florence | 18 | 2,559(0.70%)#18 | 776,448(0.00%)#3,574 |
| 19. | Seneca Gardens | 17 | 2,559(0.66%)#19 | 776,448(0.00%)#3,734 |
| 20. | Corbin | 16 | 2,559(0.63%)#20 | 776,448(0.00%)#3,777 |
| 21. | Prospect | 15 | 2,559(0.59%)#21 | 776,448(0.00%)#3,889 |
| 22. | Upton | 15 | 2,559(0.59%)#22 | 776,448(0.00%)#3,934 |
| 23. | Rineyville | 14 | 2,559(0.55%)#23 | 776,448(0.00%)#4,025 |
| 24. | Campbellsburg | 12 | 2,559(0.47%)#24 | 776,448(0.00%)#4,278 |
| 25. | Morganfield | 10 | 2,559(0.39%)#25 | 776,448(0.00%)#4,514 |
| 26. | Crayne | 10 | 2,559(0.39%)#26 | 776,448(0.00%)#4,589 |
| 27. | Hollyvilla | 9 | 2,559(0.35%)#27 | 776,448(0.00%)#4,744 |
| 28. | Covington | 8 | 2,559(0.31%)#28 | 776,448(0.00%)#4,755 |
| 29. | Manchester | 8 | 2,559(0.31%)#29 | 776,448(0.00%)#4,852 |
| 30. | Hurstbourne | 7 | 2,559(0.27%)#30 | 776,448(0.00%)#4,967 |
| 31. | Breckinridge Center | 7 | 2,559(0.27%)#31 | 776,448(0.00%)#5,002 |
| 32. | Worthington Hills | 6 | 2,559(0.23%)#32 | 776,448(0.00%)#5,152 |
| 33. | St Regis Park | 6 | 2,559(0.23%)#33 | 776,448(0.00%)#5,160 |
| 34. | Glenview Hills | 5 | 2,559(0.20%)#34 | 776,448(0.00%)#5,367 |
| 35. | Windy Hills | 4 | 2,559(0.16%)#35 | 776,448(0.00%)#5,452 |
| 36. | Whitesville | 4 | 2,559(0.16%)#36 | 776,448(0.00%)#5,540 |
| 37. | Arlington | 4 | 2,559(0.16%)#37 | 776,448(0.00%)#5,563 |
| 38. | Paducah | 3 | 2,559(0.12%)#38 | 776,448(0.00%)#5,582 |
| 39. | Danville | 3 | 2,559(0.12%)#39 | 776,448(0.00%)#5,586 |
| 40. | Southgate | 3 | 2,559(0.12%)#40 | 776,448(0.00%)#5,613 |
| 41. | Calvert City | 3 | 2,559(0.12%)#41 | 776,448(0.00%)#5,625 |
| 42. | River Bluff | 3 | 2,559(0.12%)#42 | 776,448(0.00%)#5,729 |
| 43. | Brandenburg | 2 | 2,559(0.08%)#43 | 776,448(0.00%)#5,786 |
| 44. | Wickliffe | 2 | 2,559(0.08%)#44 | 776,448(0.00%)#5,852 |
| 45. | Earlington | 1 | 2,559(0.04%)#45 | 776,448(0.00%)#5,988 |
| 46. | Glenview | 1 | 2,559(0.04%)#46 | 776,448(0.00%)#6,012 |
| 47. | Norbourne Estates | 1 | 2,559(0.04%)#47 | 776,448(0.00%)#6,026 |
| 48. | Brownsboro Village | 1 | 2,559(0.04%)#48 | 776,448(0.00%)#6,046 |
| 49. | Wildwood | 1 | 2,559(0.04%)#49 | 776,448(0.00%)#6,067 |
| 50. | Glenview Manor | 1 | 2,559(0.04%)#50 | 776,448(0.00%)#6,075 |
| 51. | Slaughters | 1 | 2,559(0.04%)#51 | 776,448(0.00%)#6,077 |
Common Questions
What are the Top 10 Cities with the Largest Spanish Community in Kentucky?
Top 10 Cities with the Largest Spanish Community in Kentucky are:
#1
655
#2
267
#3
68
#4
68
#5
49
#6
48
#7
41
#8
40
#9
37
#10
36
What city has the Largest Spanish Community in Kentucky?
Louisville has the Largest Spanish Community in Kentucky with 655.
What is the Total Spanish Population in the State of Kentucky?
Total Spanish Population in Kentucky is 2,559.
What is the Total Spanish Population in the United States?
Total Spanish Population in the United States is 776,448.