Cities with the Largest Spanish Community in New York
RELATED REPORTS & OPTIONS
Spanish
New York
Compare Cities
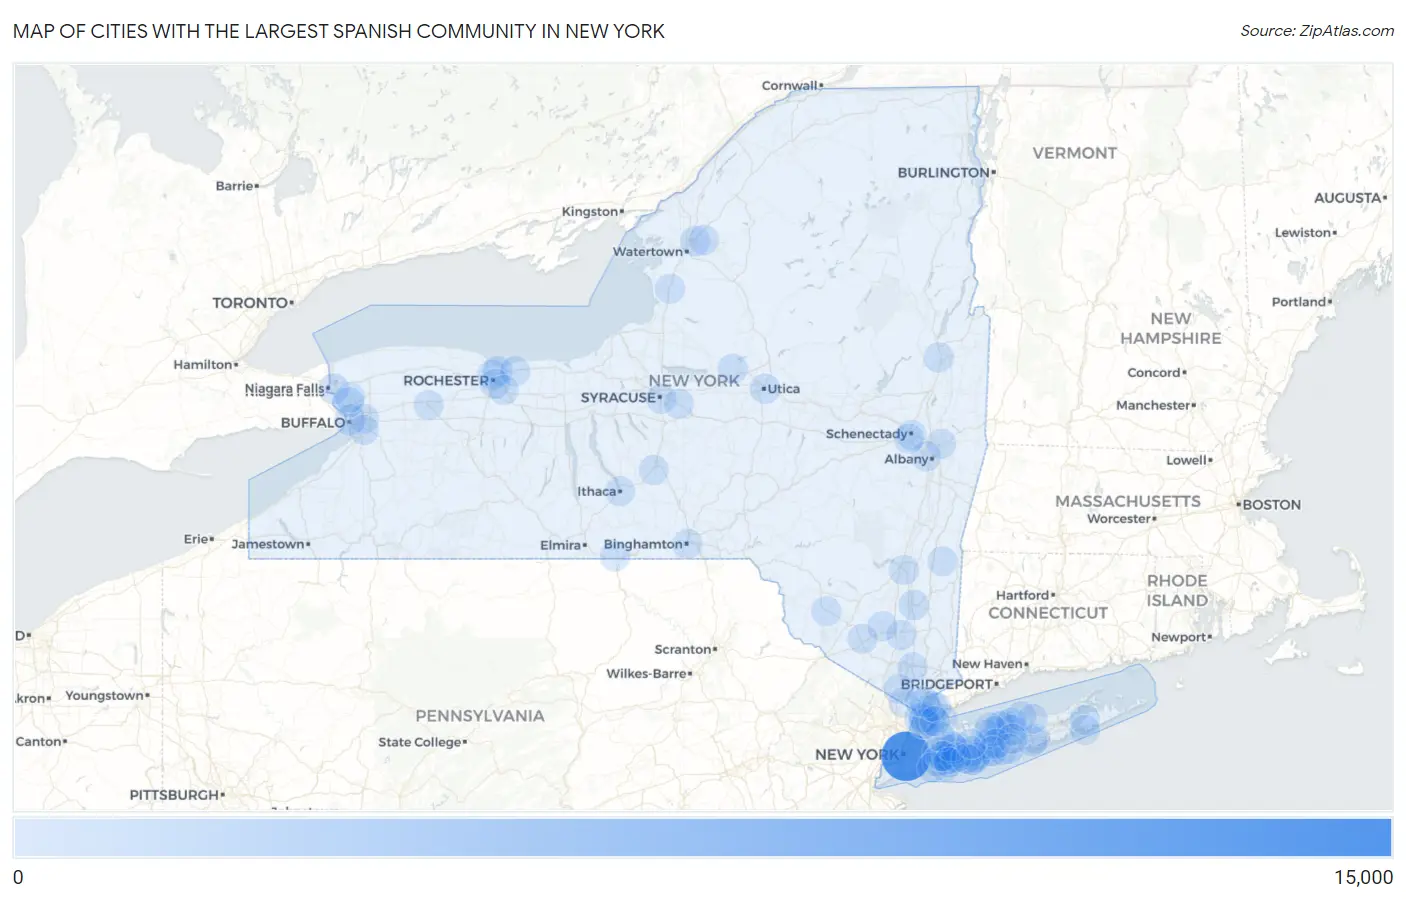
Map of Cities with the Largest Spanish Community in New York
0
15,000
Cities with the Largest Spanish Community in New York
| City | Spanish | vs State | vs National | |
| 1. | New York | 13,911 | 33,195(41.91%)#1 | 776,448(1.79%)#2 |
| 2. | Yonkers | 722 | 33,195(2.18%)#2 | 776,448(0.09%)#120 |
| 3. | Buffalo | 549 | 33,195(1.65%)#3 | 776,448(0.07%)#179 |
| 4. | Oceanside | 369 | 33,195(1.11%)#4 | 776,448(0.05%)#323 |
| 5. | Pearl River | 361 | 33,195(1.09%)#5 | 776,448(0.05%)#334 |
| 6. | Rochester | 347 | 33,195(1.05%)#6 | 776,448(0.04%)#351 |
| 7. | Niagara Falls | 304 | 33,195(0.92%)#7 | 776,448(0.04%)#413 |
| 8. | Centereach | 291 | 33,195(0.88%)#8 | 776,448(0.04%)#432 |
| 9. | Peekskill | 286 | 33,195(0.86%)#9 | 776,448(0.04%)#443 |
| 10. | Hempstead | 253 | 33,195(0.76%)#10 | 776,448(0.03%)#498 |
| 11. | Irondequoit | 249 | 33,195(0.75%)#11 | 776,448(0.03%)#509 |
| 12. | Floral Park | 243 | 33,195(0.73%)#12 | 776,448(0.03%)#523 |
| 13. | North Bay Shore | 213 | 33,195(0.64%)#13 | 776,448(0.03%)#614 |
| 14. | Copiague | 210 | 33,195(0.63%)#14 | 776,448(0.03%)#623 |
| 15. | Utica | 205 | 33,195(0.62%)#15 | 776,448(0.03%)#641 |
| 16. | Calcium | 185 | 33,195(0.56%)#16 | 776,448(0.02%)#720 |
| 17. | West Babylon | 180 | 33,195(0.54%)#17 | 776,448(0.02%)#735 |
| 18. | Poughkeepsie | 179 | 33,195(0.54%)#18 | 776,448(0.02%)#738 |
| 19. | Schenectady | 160 | 33,195(0.48%)#19 | 776,448(0.02%)#839 |
| 20. | Bronxville | 154 | 33,195(0.46%)#20 | 776,448(0.02%)#867 |
| 21. | Hicksville | 153 | 33,195(0.46%)#21 | 776,448(0.02%)#872 |
| 22. | Bay Shore | 149 | 33,195(0.45%)#22 | 776,448(0.02%)#893 |
| 23. | Albany | 143 | 33,195(0.43%)#23 | 776,448(0.02%)#931 |
| 24. | Brentwood | 143 | 33,195(0.43%)#24 | 776,448(0.02%)#932 |
| 25. | Stony Brook | 130 | 33,195(0.39%)#25 | 776,448(0.02%)#1,010 |
| 26. | Levittown | 129 | 33,195(0.39%)#26 | 776,448(0.02%)#1,013 |
| 27. | Commack | 119 | 33,195(0.36%)#27 | 776,448(0.02%)#1,086 |
| 28. | North Sea | 116 | 33,195(0.35%)#28 | 776,448(0.01%)#1,115 |
| 29. | Newburgh | 114 | 33,195(0.34%)#29 | 776,448(0.01%)#1,126 |
| 30. | Greenville Cdp Westchester County | 111 | 33,195(0.33%)#30 | 776,448(0.01%)#1,151 |
| 31. | Walden | 110 | 33,195(0.33%)#31 | 776,448(0.01%)#1,159 |
| 32. | East Farmingdale | 108 | 33,195(0.33%)#32 | 776,448(0.01%)#1,171 |
| 33. | Roosevelt | 107 | 33,195(0.32%)#33 | 776,448(0.01%)#1,175 |
| 34. | Oakdale | 106 | 33,195(0.32%)#34 | 776,448(0.01%)#1,189 |
| 35. | Tonawanda | 103 | 33,195(0.31%)#35 | 776,448(0.01%)#1,209 |
| 36. | Lindenhurst | 103 | 33,195(0.31%)#36 | 776,448(0.01%)#1,212 |
| 37. | Rockville Centre | 101 | 33,195(0.30%)#37 | 776,448(0.01%)#1,233 |
| 38. | Kingston | 100 | 33,195(0.30%)#38 | 776,448(0.01%)#1,241 |
| 39. | Mineola | 96 | 33,195(0.29%)#39 | 776,448(0.01%)#1,284 |
| 40. | New Rochelle | 95 | 33,195(0.29%)#40 | 776,448(0.01%)#1,299 |
| 41. | Binghamton | 92 | 33,195(0.28%)#41 | 776,448(0.01%)#1,335 |
| 42. | Selden | 92 | 33,195(0.28%)#42 | 776,448(0.01%)#1,336 |
| 43. | Mastic | 92 | 33,195(0.28%)#43 | 776,448(0.01%)#1,337 |
| 44. | Rye | 91 | 33,195(0.27%)#44 | 776,448(0.01%)#1,353 |
| 45. | Mount Vernon | 89 | 33,195(0.27%)#45 | 776,448(0.01%)#1,380 |
| 46. | Rome | 89 | 33,195(0.27%)#46 | 776,448(0.01%)#1,384 |
| 47. | Tuckahoe | 86 | 33,195(0.26%)#47 | 776,448(0.01%)#1,438 |
| 48. | Valley Stream | 85 | 33,195(0.26%)#48 | 776,448(0.01%)#1,443 |
| 49. | Brighton | 85 | 33,195(0.26%)#49 | 776,448(0.01%)#1,444 |
| 50. | Head Of The Harbor | 84 | 33,195(0.25%)#50 | 776,448(0.01%)#1,471 |
| 51. | Smithtown | 83 | 33,195(0.25%)#51 | 776,448(0.01%)#1,482 |
| 52. | South Hempstead | 82 | 33,195(0.25%)#52 | 776,448(0.01%)#1,511 |
| 53. | Monticello | 81 | 33,195(0.24%)#53 | 776,448(0.01%)#1,522 |
| 54. | Syracuse | 80 | 33,195(0.24%)#54 | 776,448(0.01%)#1,529 |
| 55. | Cheektowaga | 78 | 33,195(0.23%)#55 | 776,448(0.01%)#1,552 |
| 56. | Inwood | 74 | 33,195(0.22%)#56 | 776,448(0.01%)#1,609 |
| 57. | Salisbury | 73 | 33,195(0.22%)#57 | 776,448(0.01%)#1,624 |
| 58. | Fort Drum | 72 | 33,195(0.22%)#58 | 776,448(0.01%)#1,640 |
| 59. | Scotchtown | 71 | 33,195(0.21%)#59 | 776,448(0.01%)#1,659 |
| 60. | Shirley | 70 | 33,195(0.21%)#60 | 776,448(0.01%)#1,671 |
| 61. | West Hempstead | 70 | 33,195(0.21%)#61 | 776,448(0.01%)#1,673 |
| 62. | Sound Beach | 68 | 33,195(0.20%)#62 | 776,448(0.01%)#1,710 |
| 63. | Amityville | 67 | 33,195(0.20%)#63 | 776,448(0.01%)#1,727 |
| 64. | Ithaca | 64 | 33,195(0.19%)#64 | 776,448(0.01%)#1,781 |
| 65. | Pelham | 63 | 33,195(0.19%)#65 | 776,448(0.01%)#1,807 |
| 66. | Port Jefferson Station | 62 | 33,195(0.19%)#66 | 776,448(0.01%)#1,830 |
| 67. | Westbury | 61 | 33,195(0.18%)#67 | 776,448(0.01%)#1,856 |
| 68. | Webster | 61 | 33,195(0.18%)#68 | 776,448(0.01%)#1,862 |
| 69. | Kings Park | 60 | 33,195(0.18%)#69 | 776,448(0.01%)#1,882 |
| 70. | Pittsford | 59 | 33,195(0.18%)#70 | 776,448(0.01%)#1,902 |
| 71. | Franklin Square | 57 | 33,195(0.17%)#71 | 776,448(0.01%)#1,928 |
| 72. | Munsons Corners | 56 | 33,195(0.17%)#72 | 776,448(0.01%)#1,962 |
| 73. | Port Washington | 55 | 33,195(0.17%)#73 | 776,448(0.01%)#1,979 |
| 74. | Tarrytown | 55 | 33,195(0.17%)#74 | 776,448(0.01%)#1,983 |
| 75. | Southampton | 55 | 33,195(0.17%)#75 | 776,448(0.01%)#1,991 |
| 76. | White Plains | 54 | 33,195(0.16%)#76 | 776,448(0.01%)#2,000 |
| 77. | North Bellmore | 54 | 33,195(0.16%)#77 | 776,448(0.01%)#2,005 |
| 78. | Elmsford | 54 | 33,195(0.16%)#78 | 776,448(0.01%)#2,010 |
| 79. | Baldwin | 53 | 33,195(0.16%)#79 | 776,448(0.01%)#2,016 |
| 80. | Rotterdam | 53 | 33,195(0.16%)#80 | 776,448(0.01%)#2,020 |
| 81. | Sayville | 53 | 33,195(0.16%)#81 | 776,448(0.01%)#2,028 |
| 82. | West Glens Falls | 53 | 33,195(0.16%)#82 | 776,448(0.01%)#2,033 |
| 83. | Pine Plains | 53 | 33,195(0.16%)#83 | 776,448(0.01%)#2,045 |
| 84. | East Shoreham | 50 | 33,195(0.15%)#84 | 776,448(0.01%)#2,111 |
| 85. | Waverly | 50 | 33,195(0.15%)#85 | 776,448(0.01%)#2,116 |
| 86. | West Seneca | 49 | 33,195(0.15%)#86 | 776,448(0.01%)#2,124 |
| 87. | Central Islip | 49 | 33,195(0.15%)#87 | 776,448(0.01%)#2,127 |
| 88. | Harrison | 49 | 33,195(0.15%)#88 | 776,448(0.01%)#2,130 |
| 89. | Mamaroneck | 48 | 33,195(0.14%)#89 | 776,448(0.01%)#2,161 |
| 90. | Batavia | 48 | 33,195(0.14%)#90 | 776,448(0.01%)#2,164 |
| 91. | New Hempstead | 48 | 33,195(0.14%)#91 | 776,448(0.01%)#2,171 |
| 92. | Troy | 47 | 33,195(0.14%)#92 | 776,448(0.01%)#2,184 |
| 93. | Manlius | 47 | 33,195(0.14%)#93 | 776,448(0.01%)#2,202 |
| 94. | Islip | 46 | 33,195(0.14%)#94 | 776,448(0.01%)#2,224 |
| 95. | Pierrepont Manor | 46 | 33,195(0.14%)#95 | 776,448(0.01%)#2,238 |
| 96. | North Tonawanda | 42 | 33,195(0.13%)#96 | 776,448(0.01%)#2,337 |
| 97. | Holtsville | 42 | 33,195(0.13%)#97 | 776,448(0.01%)#2,342 |
| 98. | Massapequa Park | 42 | 33,195(0.13%)#98 | 776,448(0.01%)#2,344 |
| 99. | Melville | 41 | 33,195(0.12%)#99 | 776,448(0.01%)#2,382 |
| 100. | Loudonville | 41 | 33,195(0.12%)#100 | 776,448(0.01%)#2,387 |
Common Questions
What are the Top 10 Cities with the Largest Spanish Community in New York?
Top 10 Cities with the Largest Spanish Community in New York are:
#1
13,911
#2
722
#3
549
#4
369
#5
361
#6
347
#7
304
#8
291
#9
286
#10
253
What city has the Largest Spanish Community in New York?
New York has the Largest Spanish Community in New York with 13,911.
What is the Total Spanish Population in the State of New York?
Total Spanish Population in New York is 33,195.
What is the Total Spanish Population in the United States?
Total Spanish Population in the United States is 776,448.