Cities with the Largest Croatian Community in New York
RELATED REPORTS & OPTIONS
Croatian
New York
Compare Cities
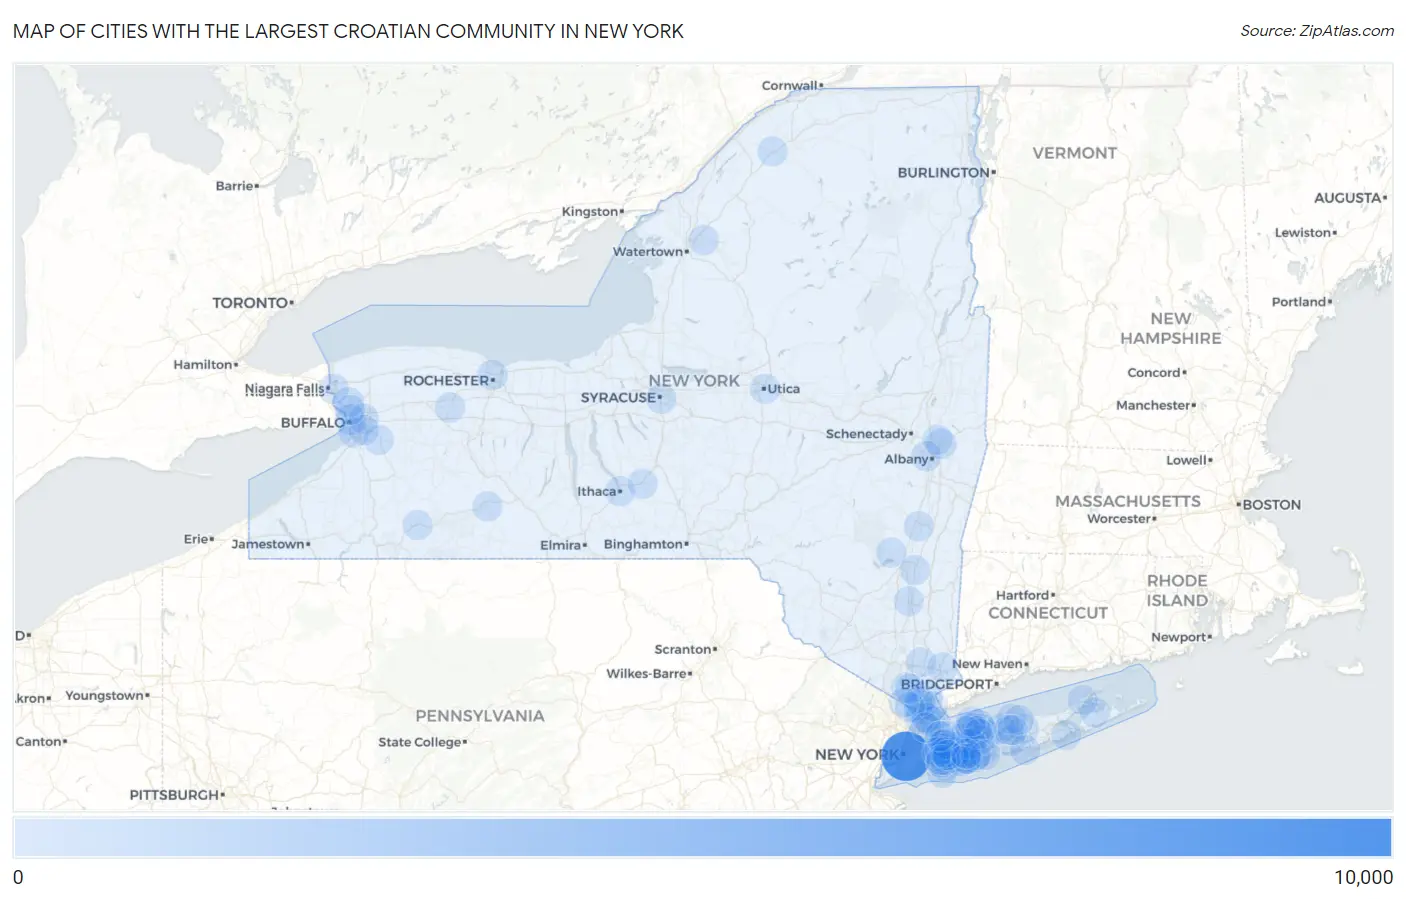
Map of Cities with the Largest Croatian Community in New York
0
10,000
Cities with the Largest Croatian Community in New York
| City | Croatian | vs State | vs National | |
| 1. | New York | 9,331 | 24,039(38.82%)#1 | 399,455(2.34%)#1 |
| 2. | Northport | 403 | 24,039(1.68%)#2 | 399,455(0.10%)#92 |
| 3. | Commack | 284 | 24,039(1.18%)#3 | 399,455(0.07%)#150 |
| 4. | Buffalo | 255 | 24,039(1.06%)#4 | 399,455(0.06%)#180 |
| 5. | Long Beach | 241 | 24,039(1.00%)#5 | 399,455(0.06%)#198 |
| 6. | Irvington | 241 | 24,039(1.00%)#6 | 399,455(0.06%)#200 |
| 7. | Yonkers | 222 | 24,039(0.92%)#7 | 399,455(0.06%)#219 |
| 8. | North Massapequa | 220 | 24,039(0.92%)#8 | 399,455(0.06%)#224 |
| 9. | Rochester | 219 | 24,039(0.91%)#9 | 399,455(0.05%)#225 |
| 10. | North New Hyde Park | 218 | 24,039(0.91%)#10 | 399,455(0.05%)#228 |
| 11. | North Babylon | 203 | 24,039(0.84%)#11 | 399,455(0.05%)#271 |
| 12. | Tonawanda | 184 | 24,039(0.77%)#12 | 399,455(0.05%)#318 |
| 13. | Troy | 172 | 24,039(0.72%)#13 | 399,455(0.04%)#347 |
| 14. | Lackawanna | 169 | 24,039(0.70%)#14 | 399,455(0.04%)#356 |
| 15. | Holbrook | 150 | 24,039(0.62%)#15 | 399,455(0.04%)#428 |
| 16. | Levittown | 149 | 24,039(0.62%)#16 | 399,455(0.04%)#434 |
| 17. | Halesite | 141 | 24,039(0.59%)#17 | 399,455(0.04%)#469 |
| 18. | Albany | 135 | 24,039(0.56%)#18 | 399,455(0.03%)#481 |
| 19. | Cheektowaga | 129 | 24,039(0.54%)#19 | 399,455(0.03%)#511 |
| 20. | Bethpage | 125 | 24,039(0.52%)#20 | 399,455(0.03%)#531 |
| 21. | Mamaroneck | 122 | 24,039(0.51%)#21 | 399,455(0.03%)#551 |
| 22. | Huntington | 121 | 24,039(0.50%)#22 | 399,455(0.03%)#558 |
| 23. | Massapequa | 111 | 24,039(0.46%)#23 | 399,455(0.03%)#615 |
| 24. | West Seneca | 105 | 24,039(0.44%)#24 | 399,455(0.03%)#656 |
| 25. | East Massapequa | 98 | 24,039(0.41%)#25 | 399,455(0.02%)#703 |
| 26. | Dobbs Ferry | 93 | 24,039(0.39%)#26 | 399,455(0.02%)#754 |
| 27. | Syosset | 90 | 24,039(0.37%)#27 | 399,455(0.02%)#776 |
| 28. | St James | 89 | 24,039(0.37%)#28 | 399,455(0.02%)#788 |
| 29. | Middle Island | 88 | 24,039(0.37%)#29 | 399,455(0.02%)#797 |
| 30. | Franklin Square | 87 | 24,039(0.36%)#30 | 399,455(0.02%)#804 |
| 31. | Garden City Park | 87 | 24,039(0.36%)#31 | 399,455(0.02%)#809 |
| 32. | Syracuse | 85 | 24,039(0.35%)#32 | 399,455(0.02%)#821 |
| 33. | Searingtown | 85 | 24,039(0.35%)#33 | 399,455(0.02%)#834 |
| 34. | New Rochelle | 83 | 24,039(0.35%)#34 | 399,455(0.02%)#845 |
| 35. | Utica | 82 | 24,039(0.34%)#35 | 399,455(0.02%)#851 |
| 36. | Canton | 82 | 24,039(0.34%)#36 | 399,455(0.02%)#862 |
| 37. | Plainedge | 81 | 24,039(0.34%)#37 | 399,455(0.02%)#872 |
| 38. | East Aurora | 79 | 24,039(0.33%)#38 | 399,455(0.02%)#892 |
| 39. | Dix Hills | 78 | 24,039(0.32%)#39 | 399,455(0.02%)#898 |
| 40. | Oceanside | 76 | 24,039(0.32%)#40 | 399,455(0.02%)#912 |
| 41. | East Northport | 76 | 24,039(0.32%)#41 | 399,455(0.02%)#914 |
| 42. | Mineola | 72 | 24,039(0.30%)#42 | 399,455(0.02%)#961 |
| 43. | Port Jefferson | 72 | 24,039(0.30%)#43 | 399,455(0.02%)#966 |
| 44. | Lake Mohegan | 72 | 24,039(0.30%)#44 | 399,455(0.02%)#967 |
| 45. | Hawthorne | 70 | 24,039(0.29%)#45 | 399,455(0.02%)#995 |
| 46. | East Meadow | 69 | 24,039(0.29%)#46 | 399,455(0.02%)#999 |
| 47. | Ithaca | 69 | 24,039(0.29%)#47 | 399,455(0.02%)#1,001 |
| 48. | Albertson | 69 | 24,039(0.29%)#48 | 399,455(0.02%)#1,006 |
| 49. | Glenwood Landing | 69 | 24,039(0.29%)#49 | 399,455(0.02%)#1,007 |
| 50. | New Hyde Park | 67 | 24,039(0.28%)#50 | 399,455(0.02%)#1,035 |
| 51. | Greenlawn | 66 | 24,039(0.27%)#51 | 399,455(0.02%)#1,052 |
| 52. | Plainview | 65 | 24,039(0.27%)#52 | 399,455(0.02%)#1,063 |
| 53. | Lindenhurst | 64 | 24,039(0.27%)#53 | 399,455(0.02%)#1,072 |
| 54. | Melville | 62 | 24,039(0.26%)#54 | 399,455(0.02%)#1,102 |
| 55. | Eastchester | 61 | 24,039(0.25%)#55 | 399,455(0.02%)#1,124 |
| 56. | Southold | 61 | 24,039(0.25%)#56 | 399,455(0.02%)#1,133 |
| 57. | North Merrick | 60 | 24,039(0.25%)#57 | 399,455(0.02%)#1,152 |
| 58. | Highland | 58 | 24,039(0.24%)#58 | 399,455(0.01%)#1,188 |
| 59. | Rockville Centre | 57 | 24,039(0.24%)#59 | 399,455(0.01%)#1,197 |
| 60. | Cold Spring Harbor | 55 | 24,039(0.23%)#60 | 399,455(0.01%)#1,239 |
| 61. | Lynbrook | 54 | 24,039(0.22%)#61 | 399,455(0.01%)#1,252 |
| 62. | Fort Drum | 52 | 24,039(0.22%)#62 | 399,455(0.01%)#1,299 |
| 63. | White Plains | 50 | 24,039(0.21%)#63 | 399,455(0.01%)#1,333 |
| 64. | Miller Place | 49 | 24,039(0.20%)#64 | 399,455(0.01%)#1,368 |
| 65. | East Quogue | 49 | 24,039(0.20%)#65 | 399,455(0.01%)#1,373 |
| 66. | Le Roy | 49 | 24,039(0.20%)#66 | 399,455(0.01%)#1,375 |
| 67. | West Islip | 46 | 24,039(0.19%)#67 | 399,455(0.01%)#1,425 |
| 68. | Elwood | 45 | 24,039(0.19%)#68 | 399,455(0.01%)#1,459 |
| 69. | Catskill | 45 | 24,039(0.19%)#69 | 399,455(0.01%)#1,464 |
| 70. | Golden S Bridge | 45 | 24,039(0.19%)#70 | 399,455(0.01%)#1,466 |
| 71. | Seaford | 43 | 24,039(0.18%)#71 | 399,455(0.01%)#1,506 |
| 72. | Centereach | 41 | 24,039(0.17%)#72 | 399,455(0.01%)#1,547 |
| 73. | Tarrytown | 41 | 24,039(0.17%)#73 | 399,455(0.01%)#1,565 |
| 74. | Niagara Falls | 39 | 24,039(0.16%)#74 | 399,455(0.01%)#1,612 |
| 75. | New City | 39 | 24,039(0.16%)#75 | 399,455(0.01%)#1,615 |
| 76. | Garden City | 39 | 24,039(0.16%)#76 | 399,455(0.01%)#1,617 |
| 77. | Floral Park | 38 | 24,039(0.16%)#77 | 399,455(0.01%)#1,647 |
| 78. | Tappan | 38 | 24,039(0.16%)#78 | 399,455(0.01%)#1,662 |
| 79. | Congers | 37 | 24,039(0.15%)#79 | 399,455(0.01%)#1,695 |
| 80. | Cuba | 37 | 24,039(0.15%)#80 | 399,455(0.01%)#1,709 |
| 81. | Noyack | 36 | 24,039(0.15%)#81 | 399,455(0.01%)#1,743 |
| 82. | Roslyn Heights | 34 | 24,039(0.14%)#82 | 399,455(0.01%)#1,826 |
| 83. | Cohoes | 33 | 24,039(0.14%)#83 | 399,455(0.01%)#1,853 |
| 84. | Hornell | 33 | 24,039(0.14%)#84 | 399,455(0.01%)#1,865 |
| 85. | North Lynbrook | 33 | 24,039(0.14%)#85 | 399,455(0.01%)#1,877 |
| 86. | Pelham Manor | 32 | 24,039(0.13%)#86 | 399,455(0.01%)#1,911 |
| 87. | Bellport | 32 | 24,039(0.13%)#87 | 399,455(0.01%)#1,924 |
| 88. | Kenmore | 31 | 24,039(0.13%)#88 | 399,455(0.01%)#1,949 |
| 89. | Port Washington | 30 | 24,039(0.12%)#89 | 399,455(0.01%)#1,983 |
| 90. | Woodstock | 30 | 24,039(0.12%)#90 | 399,455(0.01%)#2,007 |
| 91. | Bard College | 30 | 24,039(0.12%)#91 | 399,455(0.01%)#2,012 |
| 92. | West Babylon | 29 | 24,039(0.12%)#92 | 399,455(0.01%)#2,028 |
| 93. | Selden | 29 | 24,039(0.12%)#93 | 399,455(0.01%)#2,036 |
| 94. | Pearl River | 29 | 24,039(0.12%)#94 | 399,455(0.01%)#2,039 |
| 95. | Rhinebeck | 29 | 24,039(0.12%)#95 | 399,455(0.01%)#2,057 |
| 96. | Dryden | 29 | 24,039(0.12%)#96 | 399,455(0.01%)#2,060 |
| 97. | Eatons Neck | 29 | 24,039(0.12%)#97 | 399,455(0.01%)#2,062 |
| 98. | Hempstead | 28 | 24,039(0.12%)#98 | 399,455(0.01%)#2,069 |
| 99. | Massapequa Park | 28 | 24,039(0.12%)#99 | 399,455(0.01%)#2,091 |
| 100. | South Farmingdale | 28 | 24,039(0.12%)#100 | 399,455(0.01%)#2,094 |
Common Questions
What are the Top 10 Cities with the Largest Croatian Community in New York?
Top 10 Cities with the Largest Croatian Community in New York are:
#1
9,331
#2
403
#3
284
#4
255
#5
241
#6
241
#7
222
#8
220
#9
219
#10
218
What city has the Largest Croatian Community in New York?
New York has the Largest Croatian Community in New York with 9,331.
What is the Total Croatian Population in the State of New York?
Total Croatian Population in New York is 24,039.
What is the Total Croatian Population in the United States?
Total Croatian Population in the United States is 399,455.