Cities with the Most Immigrants from Eritrea in the United States
RELATED REPORTS & OPTIONS
Eritrea
United States
Compare Cities
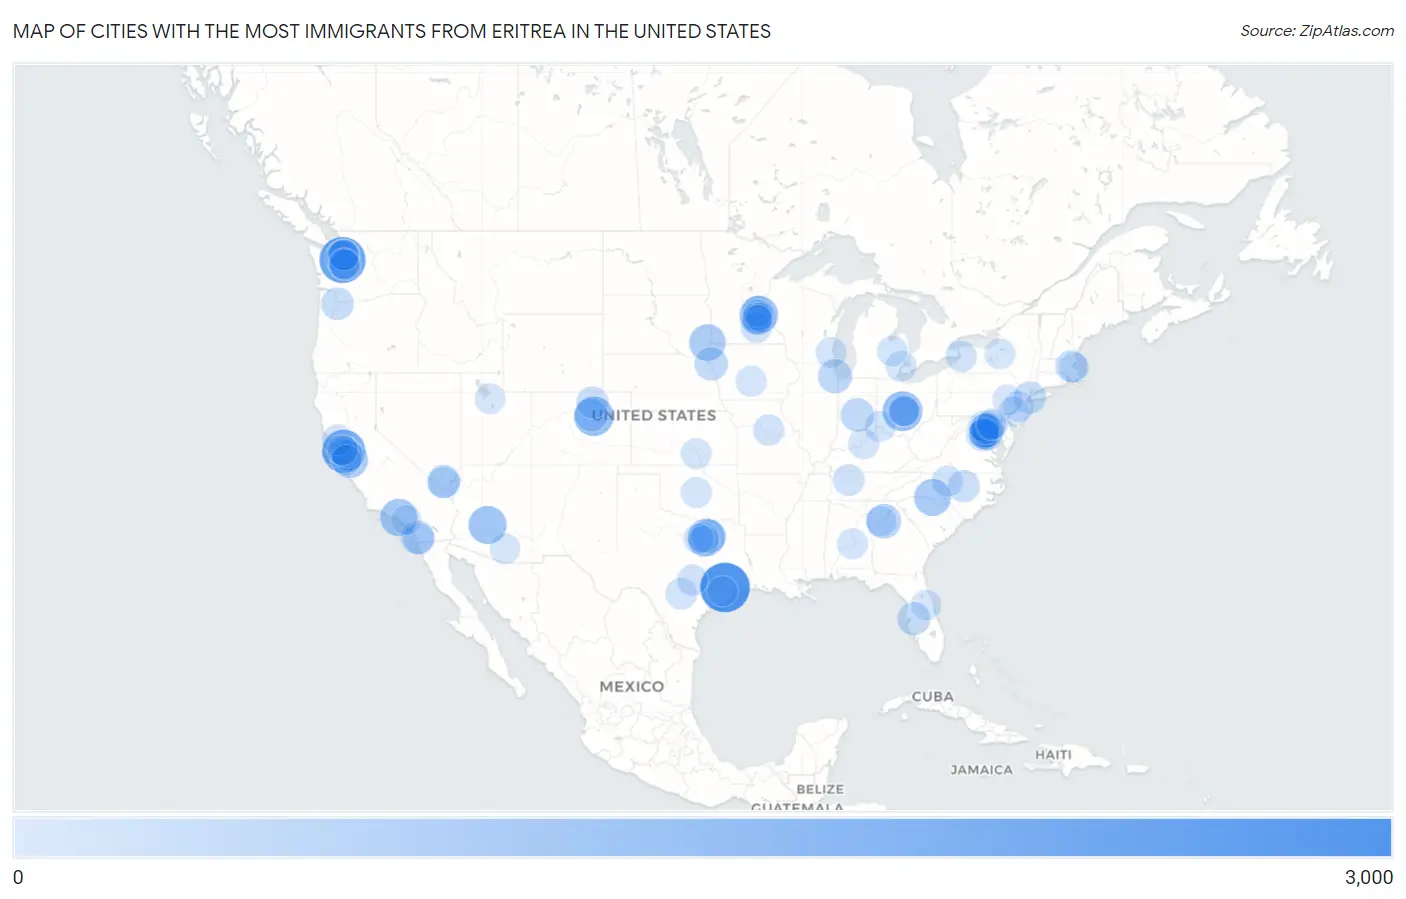
Map of Cities with the Most Immigrants from Eritrea in the United States
0
3,000
Cities with the Most Immigrants from Eritrea in the United States
| City | Eritrea | vs State | vs National | |
| 1. | Houston | 2,514 | 6,728(37.37%)#1 | 50,543(4.97%)#1 |
| 2. | Seattle | 2,065 | 4,688(44.05%)#1 | 50,543(4.09%)#2 |
| 3. | Oakland | 1,707 | 7,279(23.45%)#1 | 50,543(3.38%)#3 |
| 4. | Columbus | 1,270 | 2,596(48.92%)#1 | 50,543(2.51%)#4 |
| 5. | Aurora | 1,233 | 2,447(50.39%)#1 | 50,543(2.44%)#5 |
| 6. | St Paul | 1,116 | 2,993(37.29%)#1 | 50,543(2.21%)#6 |
| 7. | Phoenix | 1,056 | 1,326(79.64%)#1 | 50,543(2.09%)#7 |
| 8. | Dallas | 973 | 6,728(14.46%)#2 | 50,543(1.93%)#8 |
| 9. | Los Angeles | 956 | 7,279(13.13%)#2 | 50,543(1.89%)#9 |
| 10. | Charlotte | 892 | 1,716(51.98%)#1 | 50,543(1.76%)#10 |
| 11. | Sioux Falls | 856 | 975(87.79%)#1 | 50,543(1.69%)#11 |
| 12. | San Jose | 802 | 7,279(11.02%)#3 | 50,543(1.59%)#12 |
| 13. | Clarkston | 616 | 2,737(22.51%)#1 | 50,543(1.22%)#13 |
| 14. | Chicago | 564 | 735(76.73%)#1 | 50,543(1.12%)#14 |
| 15. | Shoreline | 564 | 4,688(12.03%)#2 | 50,543(1.12%)#15 |
| 16. | Garland | 542 | 6,728(8.06%)#3 | 50,543(1.07%)#16 |
| 17. | San Diego | 518 | 7,279(7.12%)#4 | 50,543(1.02%)#17 |
| 18. | Indianapolis | 486 | 804(60.45%)#1 | 50,543(0.96%)#18 |
| 19. | Sioux City | 476 | 898(53.01%)#1 | 50,543(0.94%)#19 |
| 20. | Denver | 445 | 2,447(18.19%)#2 | 50,543(0.88%)#20 |
| 21. | Valrico | 421 | 735(57.28%)#1 | 50,543(0.83%)#21 |
| 22. | Spring Valley | 410 | 1,000(41.00%)#1 | 50,543(0.81%)#22 |
| 23. | Portland | 378 | 463(81.64%)#1 | 50,543(0.75%)#23 |
| 24. | Alexandria | 377 | 3,058(12.33%)#1 | 50,543(0.75%)#24 |
| 25. | Chillum | 377 | 2,915(12.93%)#1 | 50,543(0.75%)#25 |
| 26. | Lake Ridge | 352 | 3,058(11.51%)#2 | 50,543(0.70%)#26 |
| 27. | Kingstowne | 318 | 3,058(10.40%)#3 | 50,543(0.63%)#27 |
| 28. | Lynnwood | 316 | 4,688(6.74%)#3 | 50,543(0.63%)#28 |
| 29. | Greeley | 314 | 2,447(12.83%)#3 | 50,543(0.62%)#29 |
| 30. | Arlington | 312 | 3,058(10.20%)#4 | 50,543(0.62%)#30 |
| 31. | New York | 308 | 860(35.81%)#1 | 50,543(0.61%)#31 |
| 32. | Raleigh | 308 | 1,716(17.95%)#2 | 50,543(0.61%)#32 |
| 33. | Washington | 299 | 299(100.00%)#1 | 50,543(0.59%)#33 |
| 34. | Cambridge | 296 | 743(39.84%)#1 | 50,543(0.59%)#34 |
| 35. | Enterprise | 281 | 1,000(28.10%)#2 | 50,543(0.56%)#35 |
| 36. | Renton | 277 | 4,688(5.91%)#4 | 50,543(0.55%)#36 |
| 37. | Silver Spring | 271 | 2,915(9.30%)#2 | 50,543(0.54%)#37 |
| 38. | Fremont | 269 | 7,279(3.70%)#5 | 50,543(0.53%)#38 |
| 39. | Nashville | 255 | 350(72.86%)#1 | 50,543(0.50%)#39 |
| 40. | Springfield | 251 | 3,058(8.21%)#5 | 50,543(0.50%)#40 |
| 41. | Gahanna | 235 | 2,596(9.05%)#2 | 50,543(0.46%)#41 |
| 42. | San Antonio | 229 | 6,728(3.40%)#4 | 50,543(0.45%)#42 |
| 43. | Greensboro | 217 | 1,716(12.65%)#3 | 50,543(0.43%)#43 |
| 44. | San Francisco | 213 | 7,279(2.93%)#6 | 50,543(0.42%)#44 |
| 45. | Cedar Hill | 213 | 6,728(3.17%)#5 | 50,543(0.42%)#45 |
| 46. | Minneapolis | 212 | 2,993(7.08%)#2 | 50,543(0.42%)#46 |
| 47. | North Lynnwood | 208 | 4,688(4.44%)#5 | 50,543(0.41%)#47 |
| 48. | Columbia | 205 | 498(41.16%)#1 | 50,543(0.41%)#48 |
| 49. | Burnsville | 202 | 2,993(6.75%)#3 | 50,543(0.40%)#49 |
| 50. | Buffalo | 199 | 860(23.14%)#2 | 50,543(0.39%)#50 |
| 51. | Wheaton | 196 | 2,915(6.72%)#3 | 50,543(0.39%)#51 |
| 52. | Austin | 193 | 6,728(2.87%)#6 | 50,543(0.38%)#52 |
| 53. | Faribault | 192 | 2,993(6.41%)#4 | 50,543(0.38%)#53 |
| 54. | Green Valley | 192 | 2,915(6.59%)#4 | 50,543(0.38%)#54 |
| 55. | La Mesa | 190 | 7,279(2.61%)#7 | 50,543(0.38%)#55 |
| 56. | Oklahoma City | 188 | 467(40.26%)#1 | 50,543(0.37%)#56 |
| 57. | Union City | 187 | 7,279(2.57%)#8 | 50,543(0.37%)#57 |
| 58. | Des Moines | 186 | 898(20.71%)#2 | 50,543(0.37%)#58 |
| 59. | Accokeek | 184 | 2,915(6.31%)#5 | 50,543(0.36%)#59 |
| 60. | Milwaukee | 182 | 231(78.79%)#1 | 50,543(0.36%)#60 |
| 61. | Santa Rosa | 180 | 7,279(2.47%)#9 | 50,543(0.36%)#61 |
| 62. | Cincinnati | 178 | 2,596(6.86%)#3 | 50,543(0.35%)#62 |
| 63. | Wichita | 173 | 295(58.64%)#1 | 50,543(0.34%)#63 |
| 64. | Germantown | 171 | 2,915(5.87%)#6 | 50,543(0.34%)#64 |
| 65. | Blaine | 168 | 2,993(5.61%)#5 | 50,543(0.33%)#65 |
| 66. | Detroit | 161 | 550(29.27%)#1 | 50,543(0.32%)#66 |
| 67. | Irving | 160 | 6,728(2.38%)#7 | 50,543(0.32%)#67 |
| 68. | Mount Morris | 160 | 550(29.09%)#2 | 50,543(0.32%)#68 |
| 69. | Castro Valley | 157 | 7,279(2.16%)#10 | 50,543(0.31%)#69 |
| 70. | Bailey S Crossroads | 157 | 3,058(5.13%)#6 | 50,543(0.31%)#70 |
| 71. | Prattville | 154 | 154(100.00%)#1 | 50,543(0.30%)#71 |
| 72. | Lake Stickney | 154 | 4,688(3.28%)#6 | 50,543(0.30%)#72 |
| 73. | Louisville | 153 | 207(73.91%)#1 | 50,543(0.30%)#73 |
| 74. | Alameda | 147 | 7,279(2.02%)#11 | 50,543(0.29%)#74 |
| 75. | Syracuse | 146 | 860(16.98%)#3 | 50,543(0.29%)#75 |
| 76. | Kent | 145 | 4,688(3.09%)#7 | 50,543(0.29%)#76 |
| 77. | Tukwila | 142 | 4,688(3.03%)#8 | 50,543(0.28%)#77 |
| 78. | Baltimore | 140 | 2,915(4.80%)#7 | 50,543(0.28%)#78 |
| 79. | Trenton | 136 | 417(32.61%)#1 | 50,543(0.27%)#79 |
| 80. | Tucson | 135 | 1,326(10.18%)#2 | 50,543(0.27%)#80 |
| 81. | Maplewood | 135 | 2,993(4.51%)#6 | 50,543(0.27%)#81 |
| 82. | Atlanta | 130 | 2,737(4.75%)#2 | 50,543(0.26%)#82 |
| 83. | Eagan | 127 | 2,993(4.24%)#7 | 50,543(0.25%)#83 |
| 84. | Potomac | 127 | 2,915(4.36%)#8 | 50,543(0.25%)#84 |
| 85. | Trexlertown | 127 | 554(22.92%)#1 | 50,543(0.25%)#85 |
| 86. | West Valley City | 121 | 195(62.05%)#1 | 50,543(0.24%)#86 |
| 87. | Reynoldsburg | 121 | 2,596(4.66%)#4 | 50,543(0.24%)#87 |
| 88. | Fort Worth | 120 | 6,728(1.78%)#8 | 50,543(0.24%)#88 |
| 89. | Burke | 118 | 3,058(3.86%)#7 | 50,543(0.23%)#89 |
| 90. | Cupertino | 117 | 7,279(1.61%)#12 | 50,543(0.23%)#90 |
| 91. | Philadelphia | 115 | 554(20.76%)#2 | 50,543(0.23%)#91 |
| 92. | Whitehall | 115 | 2,596(4.43%)#5 | 50,543(0.23%)#92 |
| 93. | Boston | 112 | 743(15.07%)#2 | 50,543(0.22%)#93 |
| 94. | Cottage Grove | 111 | 2,993(3.71%)#8 | 50,543(0.22%)#94 |
| 95. | Anaheim | 110 | 7,279(1.51%)#13 | 50,543(0.22%)#95 |
| 96. | Sugar Land | 110 | 6,728(1.63%)#9 | 50,543(0.22%)#96 |
| 97. | Sanford | 110 | 735(14.97%)#2 | 50,543(0.22%)#97 |
| 98. | Apple Valley | 110 | 2,993(3.68%)#9 | 50,543(0.22%)#98 |
| 99. | Catonsville | 110 | 2,915(3.77%)#9 | 50,543(0.22%)#99 |
| 100. | Berkeley | 109 | 7,279(1.50%)#14 | 50,543(0.22%)#100 |
Common Questions
What are the Top 10 Cities with the Most Immigrants from Eritrea in the United States?
Top 10 Cities with the Most Immigrants from Eritrea in the United States are:
What city has the Most Immigrants from Eritrea in the United States?
Houston has the Most Immigrants from Eritrea in the United States with 2,514.
What is the Total Immigrants from Eritrea in the United States?
Total Immigrants from Eritrea in the United States is 50,543.