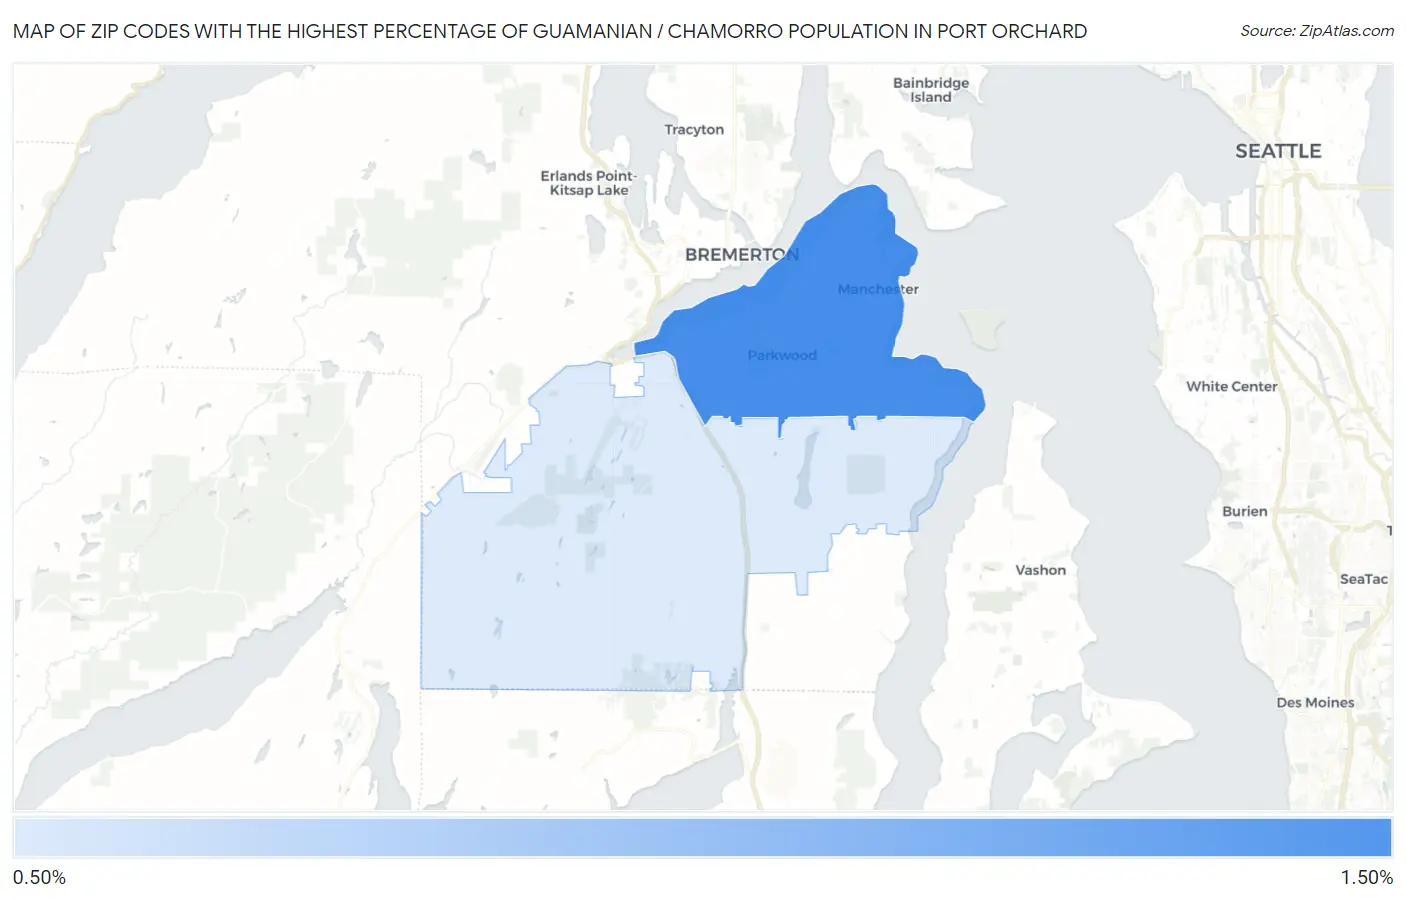
Zip Codes with the Highest Percentage of Guamanian / Chamorro Population in Port Orchard, WA
RELATED REPORTS & OPTIONS
Guamanian / Chamorro
Port Orchard
Compare Zip Codes
Map of Zip Codes with the Highest Percentage of Guamanian / Chamorro Population in Port Orchard
0.79%
1.20%
Zip Codes with the Highest Percentage of Guamanian / Chamorro Population in Port Orchard, WA
| Zip Code | Guamanian / Chamorro | vs State | vs National | |
| 1. | 98366 | 1.20% | 0.26%(+0.940)#14 | 0.047%(+1.16)#117 |
| 2. | 98367 | 0.79% | 0.26%(+0.524)#33 | 0.047%(+0.742)#230 |
1
Common Questions
What are the Top Zip Codes with the Highest Percentage of Guamanian / Chamorro Population in Port Orchard, WA?
Top Zip Codes with the Highest Percentage of Guamanian / Chamorro Population in Port Orchard, WA are:
What zip code has the Highest Percentage of Guamanian / Chamorro Population in Port Orchard, WA?
98366 has the Highest Percentage of Guamanian / Chamorro Population in Port Orchard, WA with 1.20%.
What is the Percentage of Guamanian / Chamorro Population in Port Orchard, WA?
Percentage of Guamanian / Chamorro Population in Port Orchard is 0.97%.
What is the Percentage of Guamanian / Chamorro Population in Washington?
Percentage of Guamanian / Chamorro Population in Washington is 0.26%.
What is the Percentage of Guamanian / Chamorro Population in the United States?
Percentage of Guamanian / Chamorro Population in the United States is 0.047%.