Cities with the Largest Finnish Community in the United States
RELATED REPORTS & OPTIONS
Finnish
United States
Compare Cities
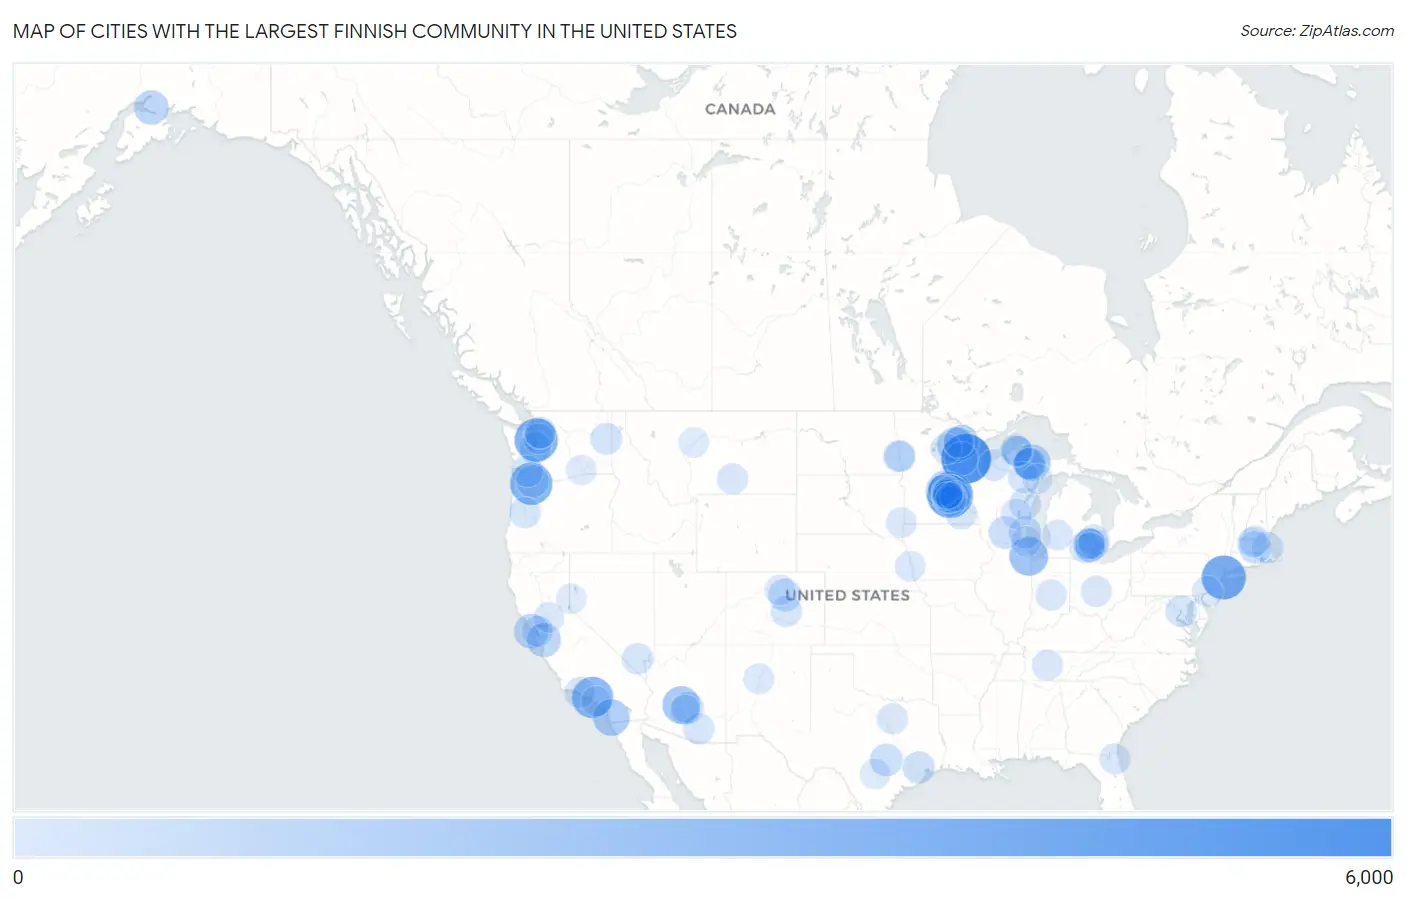
Map of Cities with the Largest Finnish Community in the United States
0
6,000
Cities with the Largest Finnish Community in the United States
| City | Finnish | vs State | vs National | |
| 1. | Duluth | 5,463 | 97,679(5.59%)#1 | 628,742(0.87%)#1 |
| 2. | Minneapolis | 4,500 | 97,679(4.61%)#2 | 628,742(0.72%)#2 |
| 3. | New York | 4,052 | 14,933(27.13%)#1 | 628,742(0.64%)#3 |
| 4. | Seattle | 3,832 | 47,192(8.12%)#1 | 628,742(0.61%)#4 |
| 5. | Portland | 3,576 | 20,945(17.07%)#1 | 628,742(0.57%)#5 |
| 6. | Los Angeles | 3,342 | 50,326(6.64%)#1 | 628,742(0.53%)#6 |
| 7. | Chicago | 2,666 | 14,662(18.18%)#1 | 628,742(0.42%)#7 |
| 8. | St Paul | 2,461 | 97,679(2.52%)#3 | 628,742(0.39%)#8 |
| 9. | Phoenix | 2,377 | 14,922(15.93%)#1 | 628,742(0.38%)#9 |
| 10. | San Diego | 2,129 | 50,326(4.23%)#2 | 628,742(0.34%)#10 |
| 11. | Marquette | 1,981 | 87,968(2.25%)#1 | 628,742(0.32%)#11 |
| 12. | Hibbing | 1,857 | 97,679(1.90%)#4 | 628,742(0.30%)#12 |
| 13. | Virginia | 1,751 | 97,679(1.79%)#5 | 628,742(0.28%)#13 |
| 14. | San Francisco | 1,655 | 50,326(3.29%)#3 | 628,742(0.26%)#14 |
| 15. | Anchorage | 1,597 | 4,112(38.84%)#1 | 628,742(0.25%)#15 |
| 16. | San Jose | 1,544 | 50,326(3.07%)#4 | 628,742(0.25%)#16 |
| 17. | Elk River | 1,516 | 97,679(1.55%)#6 | 628,742(0.24%)#17 |
| 18. | Coon Rapids | 1,492 | 97,679(1.53%)#7 | 628,742(0.24%)#18 |
| 19. | Cloquet | 1,380 | 97,679(1.41%)#8 | 628,742(0.22%)#19 |
| 20. | Ishpeming | 1,319 | 87,968(1.50%)#2 | 628,742(0.21%)#20 |
| 21. | Livonia | 1,191 | 87,968(1.35%)#3 | 628,742(0.19%)#21 |
| 22. | Madison | 1,172 | 37,028(3.17%)#1 | 628,742(0.19%)#22 |
| 23. | Austin | 1,169 | 17,261(6.77%)#1 | 628,742(0.19%)#23 |
| 24. | Denver | 1,165 | 12,458(9.35%)#1 | 628,742(0.19%)#24 |
| 25. | Vancouver | 1,127 | 47,192(2.39%)#2 | 628,742(0.18%)#25 |
| 26. | Blaine | 1,117 | 97,679(1.14%)#9 | 628,742(0.18%)#26 |
| 27. | Milwaukee | 1,116 | 37,028(3.01%)#2 | 628,742(0.18%)#27 |
| 28. | Houston | 1,054 | 17,261(6.11%)#2 | 628,742(0.17%)#28 |
| 29. | Worcester | 1,034 | 22,107(4.68%)#1 | 628,742(0.16%)#29 |
| 30. | Mesa | 980 | 14,922(6.57%)#2 | 628,742(0.16%)#30 |
| 31. | Plymouth | 960 | 97,679(0.98%)#10 | 628,742(0.15%)#31 |
| 32. | Negaunee | 922 | 87,968(1.05%)#4 | 628,742(0.15%)#32 |
| 33. | Buffalo | 921 | 97,679(0.94%)#11 | 628,742(0.15%)#33 |
| 34. | Tacoma | 916 | 47,192(1.94%)#3 | 628,742(0.15%)#34 |
| 35. | Green Bay | 906 | 37,028(2.45%)#3 | 628,742(0.14%)#35 |
| 36. | Washington | 904 | 904(100.00%)#1 | 628,742(0.14%)#36 |
| 37. | Spokane | 904 | 47,192(1.92%)#4 | 628,742(0.14%)#37 |
| 38. | Maple Grove | 900 | 97,679(0.92%)#12 | 628,742(0.14%)#38 |
| 39. | Fargo | 899 | 4,372(20.56%)#1 | 628,742(0.14%)#39 |
| 40. | Lake Stevens | 894 | 47,192(1.89%)#5 | 628,742(0.14%)#40 |
| 41. | Longview | 890 | 47,192(1.89%)#6 | 628,742(0.14%)#41 |
| 42. | Ironwood | 886 | 87,968(1.01%)#5 | 628,742(0.14%)#42 |
| 43. | Houghton | 875 | 87,968(0.99%)#6 | 628,742(0.14%)#43 |
| 44. | Brooklyn Park | 849 | 97,679(0.87%)#13 | 628,742(0.14%)#44 |
| 45. | Boston | 844 | 22,107(3.82%)#2 | 628,742(0.13%)#45 |
| 46. | Apple Valley | 844 | 97,679(0.86%)#14 | 628,742(0.13%)#46 |
| 47. | Ann Arbor | 834 | 87,968(0.95%)#7 | 628,742(0.13%)#47 |
| 48. | Tucson | 822 | 14,922(5.51%)#3 | 628,742(0.13%)#48 |
| 49. | Bloomington | 818 | 97,679(0.84%)#15 | 628,742(0.13%)#49 |
| 50. | Hancock | 817 | 87,968(0.93%)#8 | 628,742(0.13%)#50 |
| 51. | Iron Mountain | 810 | 87,968(0.92%)#9 | 628,742(0.13%)#51 |
| 52. | Rochester | 802 | 97,679(0.82%)#16 | 628,742(0.13%)#52 |
| 53. | Las Vegas | 787 | 4,807(16.37%)#1 | 628,742(0.13%)#53 |
| 54. | Eugene | 782 | 20,945(3.73%)#2 | 628,742(0.12%)#54 |
| 55. | Colorado Springs | 780 | 12,458(6.26%)#2 | 628,742(0.12%)#55 |
| 56. | Oakland | 774 | 50,326(1.54%)#5 | 628,742(0.12%)#56 |
| 57. | Indianapolis | 757 | 6,446(11.74%)#1 | 628,742(0.12%)#57 |
| 58. | Novi | 754 | 87,968(0.86%)#10 | 628,742(0.12%)#58 |
| 59. | Rochester Hills | 752 | 87,968(0.85%)#11 | 628,742(0.12%)#59 |
| 60. | West Ishpeming | 750 | 87,968(0.85%)#12 | 628,742(0.12%)#60 |
| 61. | San Buenaventura Ventura | 748 | 50,326(1.49%)#6 | 628,742(0.12%)#61 |
| 62. | Lakeville | 743 | 97,679(0.76%)#17 | 628,742(0.12%)#62 |
| 63. | Jacksonville | 739 | 26,256(2.81%)#1 | 628,742(0.12%)#63 |
| 64. | Columbus | 732 | 17,609(4.16%)#1 | 628,742(0.12%)#64 |
| 65. | Royal Oak | 719 | 87,968(0.82%)#13 | 628,742(0.11%)#65 |
| 66. | Billings | 717 | 6,913(10.37%)#1 | 628,742(0.11%)#66 |
| 67. | Murfreesboro | 713 | 4,861(14.67%)#1 | 628,742(0.11%)#67 |
| 68. | Albertville | 702 | 97,679(0.72%)#18 | 628,742(0.11%)#68 |
| 69. | Moorhead | 700 | 97,679(0.72%)#19 | 628,742(0.11%)#69 |
| 70. | Fitchburg | 698 | 22,107(3.16%)#3 | 628,742(0.11%)#70 |
| 71. | Fort Worth | 696 | 17,261(4.03%)#3 | 628,742(0.11%)#71 |
| 72. | Grand Rapids | 694 | 97,679(0.71%)#20 | 628,742(0.11%)#72 |
| 73. | Kirkland | 675 | 47,192(1.43%)#7 | 628,742(0.11%)#73 |
| 74. | Philadelphia | 669 | 7,986(8.38%)#1 | 628,742(0.11%)#74 |
| 75. | Oshkosh | 664 | 37,028(1.79%)#4 | 628,742(0.11%)#75 |
| 76. | Omaha | 642 | 1,944(33.02%)#1 | 628,742(0.10%)#76 |
| 77. | Kenosha | 638 | 37,028(1.72%)#5 | 628,742(0.10%)#77 |
| 78. | Farmington Hills | 634 | 87,968(0.72%)#14 | 628,742(0.10%)#78 |
| 79. | Mountain Iron | 632 | 97,679(0.65%)#21 | 628,742(0.10%)#79 |
| 80. | Sacramento | 628 | 50,326(1.25%)#7 | 628,742(0.10%)#80 |
| 81. | Grand Rapids | 628 | 87,968(0.71%)#15 | 628,742(0.10%)#81 |
| 82. | Dollar Bay | 627 | 87,968(0.71%)#16 | 628,742(0.10%)#82 |
| 83. | Boulder | 620 | 12,458(4.98%)#3 | 628,742(0.10%)#83 |
| 84. | Minnetonka | 620 | 97,679(0.63%)#22 | 628,742(0.10%)#84 |
| 85. | Sioux Falls | 615 | 4,202(14.64%)#1 | 628,742(0.10%)#85 |
| 86. | Chandler | 614 | 14,922(4.11%)#4 | 628,742(0.10%)#86 |
| 87. | Eden Prairie | 614 | 97,679(0.63%)#23 | 628,742(0.10%)#87 |
| 88. | Long Beach | 612 | 50,326(1.22%)#8 | 628,742(0.10%)#88 |
| 89. | Albuquerque | 611 | 2,390(25.56%)#1 | 628,742(0.10%)#89 |
| 90. | Woodbury | 609 | 97,679(0.62%)#24 | 628,742(0.10%)#90 |
| 91. | Escanaba | 602 | 87,968(0.68%)#17 | 628,742(0.10%)#91 |
| 92. | Reno | 600 | 4,807(12.48%)#2 | 628,742(0.10%)#92 |
| 93. | Eagan | 590 | 97,679(0.60%)#25 | 628,742(0.09%)#93 |
| 94. | Everett | 584 | 47,192(1.24%)#8 | 628,742(0.09%)#94 |
| 95. | Gardner | 582 | 22,107(2.63%)#4 | 628,742(0.09%)#95 |
| 96. | Kennewick | 580 | 47,192(1.23%)#9 | 628,742(0.09%)#96 |
| 97. | San Antonio | 577 | 17,261(3.34%)#4 | 628,742(0.09%)#97 |
| 98. | Westland | 568 | 87,968(0.65%)#18 | 628,742(0.09%)#98 |
| 99. | Great Falls | 568 | 6,913(8.22%)#2 | 628,742(0.09%)#99 |
| 100. | New Hope | 567 | 97,679(0.58%)#26 | 628,742(0.09%)#100 |
Common Questions
What are the Top 10 Cities with the Largest Finnish Community in the United States?
Top 10 Cities with the Largest Finnish Community in the United States are:
What city has the Largest Finnish Community in the United States?
Duluth has the Largest Finnish Community in the United States with 5,463.
What is the Total Finnish Population in the United States?
Total Finnish Population in the United States is 628,742.