States with the Highest Per Capita Income
RELATED REPORTS & OPTIONS
Highest Per Capita Income
United States
Compare States
Map of States with the Highest Per Capita Income
$20,000
$60,000
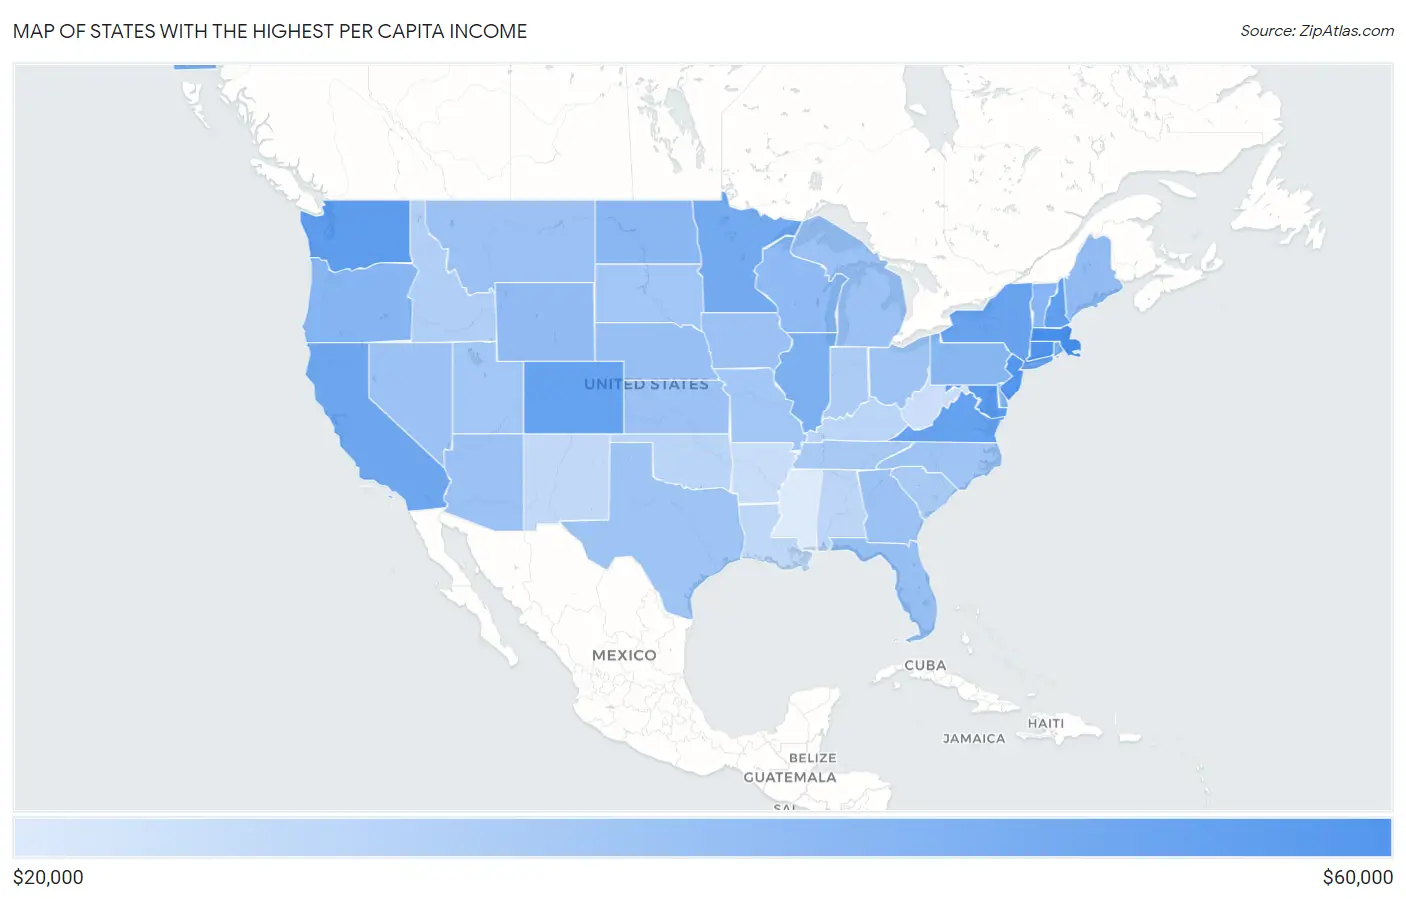
States with the Highest Per Capita Income in the United States
| State | Per Capita Income | vs State Median | vs National | |
| 1. | Massachusetts | $53,513 | $38,460 (+15.1k) | $41,261(+12.3k) |
| 2. | Connecticut | $52,034 | $38,460 (+13.6k) | $41,261(+10.8k) |
| 3. | New Jersey | $50,995 | $38,460 (+12.5k) | $41,261(+9.73k) |
| 4. | Maryland | $49,865 | $38,460 (+11.4k) | $41,261(+8.60k) |
| 5. | Washington | $48,685 | $38,460 (+10.2k) | $41,261(+7.42k) |
| 6. | New Hampshire | $48,250 | $38,460 (+9.79k) | $41,261(+6.99k) |
| 7. | Colorado | $47,346 | $38,460 (+8.89k) | $41,261(+6.08k) |
| 8. | Virginia | $47,210 | $38,460 (+8.75k) | $41,261(+5.95k) |
| 9. | New York | $47,173 | $38,460 (+8.71k) | $41,261(+5.91k) |
| 10. | California | $45,591 | $38,460 (+7.13k) | $41,261(+4.33k) |
| 11. | Minnesota | $44,947 | $38,460 (+6.49k) | $41,261(+3.69k) |
| 12. | Rhode Island | $43,324 | $38,460 (+4.86k) | $41,261(+2.06k) |
| 13. | Illinois | $43,198 | $38,460 (+4.74k) | $41,261(+1.94k) |
| 14. | Alaska | $42,828 | $38,460 (+4.37k) | $41,261(+1.57k) |
| 15. | Hawaii | $42,683 | $38,460 (+4.22k) | $41,261(+1.42k) |
| 16. | Delaware | $42,180 | $38,460 (+3.72k) | $41,261(+919) |
| 17. | Oregon | $41,805 | $38,460 (+3.35k) | $41,261(+544) |
| 18. | Vermont | $41,680 | $38,460 (+3.22k) | $41,261(+419) |
| 19. | Pennsylvania | $41,234 | $38,460 (+2.77k) | $41,261(-27.0) |
| 20. | North Dakota | $40,748 | $38,460 (+2.29k) | $41,261(-513) |
| 21. | Wisconsin | $40,130 | $38,460 (+1.67k) | $41,261(-1.13k) |
| 22. | Maine | $39,718 | $38,460 (+1.26k) | $41,261(-1.54k) |
| 23. | Wyoming | $39,547 | $38,460 (+1.09k) | $41,261(-1.71k) |
| 24. | Florida | $38,850 | $38,460 (+390) | $41,261(-2.41k) |
| 25. | Nebraska | $38,585 | $38,460 (+126) | $41,261(-2.68k) |
| 26. | Arizona | $38,334 | $38,460 (-126) | $41,261(-2.93k) |
| 27. | Kansas | $38,108 | $38,460 (-352) | $41,261(-3.15k) |
| 28. | Iowa | $37,949 | $38,460 (-510) | $41,261(-3.31k) |
| 29. | Nevada | $37,945 | $38,460 (-514) | $41,261(-3.32k) |
| 30. | Michigan | $37,929 | $38,460 (-530) | $41,261(-3.33k) |
| 31. | Montana | $37,837 | $38,460 (-622) | $41,261(-3.42k) |
| 32. | Georgia | $37,836 | $38,460 (-624) | $41,261(-3.42k) |
| 33. | Ohio | $37,729 | $38,460 (-730) | $41,261(-3.53k) |
| 34. | North Carolina | $37,641 | $38,460 (-818) | $41,261(-3.62k) |
| 35. | Texas | $37,514 | $38,460 (-946) | $41,261(-3.75k) |
| 36. | Utah | $37,023 | $38,460 (-1.44k) | $41,261(-4.24k) |
| 37. | South Dakota | $36,850 | $38,460 (-1.61k) | $41,261(-4.41k) |
| 38. | Missouri | $36,754 | $38,460 (-1.71k) | $41,261(-4.51k) |
| 39. | South Carolina | $36,072 | $38,460 (-2.39k) | $41,261(-5.19k) |
| 40. | Tennessee | $36,040 | $38,460 (-2.42k) | $41,261(-5.22k) |
| 41. | Indiana | $35,578 | $38,460 (-2.88k) | $41,261(-5.68k) |
| 42. | Idaho | $34,919 | $38,460 (-3.54k) | $41,261(-6.34k) |
| 43. | Oklahoma | $33,630 | $38,460 (-4.83k) | $41,261(-7.63k) |
| 44. | Kentucky | $33,515 | $38,460 (-4.94k) | $41,261(-7.75k) |
| 45. | Alabama | $33,344 | $38,460 (-5.12k) | $41,261(-7.92k) |
| 46. | Louisiana | $32,981 | $38,460 (-5.48k) | $41,261(-8.28k) |
| 47. | New Mexico | $32,667 | $38,460 (-5.79k) | $41,261(-8.59k) |
| 48. | Arkansas | $31,868 | $38,460 (-6.59k) | $41,261(-9.39k) |
| 49. | West Virginia | $31,462 | $38,460 (-7.00k) | $41,261(-9.80k) |
| 50. | Mississippi | $29,209 | $38,460 (-9.25k) | $41,261(-12.1k) |
1
Common Questions
What are the Top 10 States with the Highest Per Capita Income in the United States?
Top 10 States with the Highest Per Capita Income in the United States are:
#1
$53,513
#2
$52,034
#3
$50,995
#4
$49,865
#5
$48,685
#6
$48,250
#7
$47,346
#8
$47,210
#9
$47,173
#10
$45,591
What state has the Highest Per Capita Income in the United States?
Massachusetts has the Highest Per Capita Income in the United States with $53,513.
What is the Per Capita Income in the United States?
Per Capita Income in the United States is $41,261.