Cities with the Highest Per Capita Income in Massachusetts
RELATED REPORTS & OPTIONS
Highest Per Capita Income
Massachusetts
Compare Cities
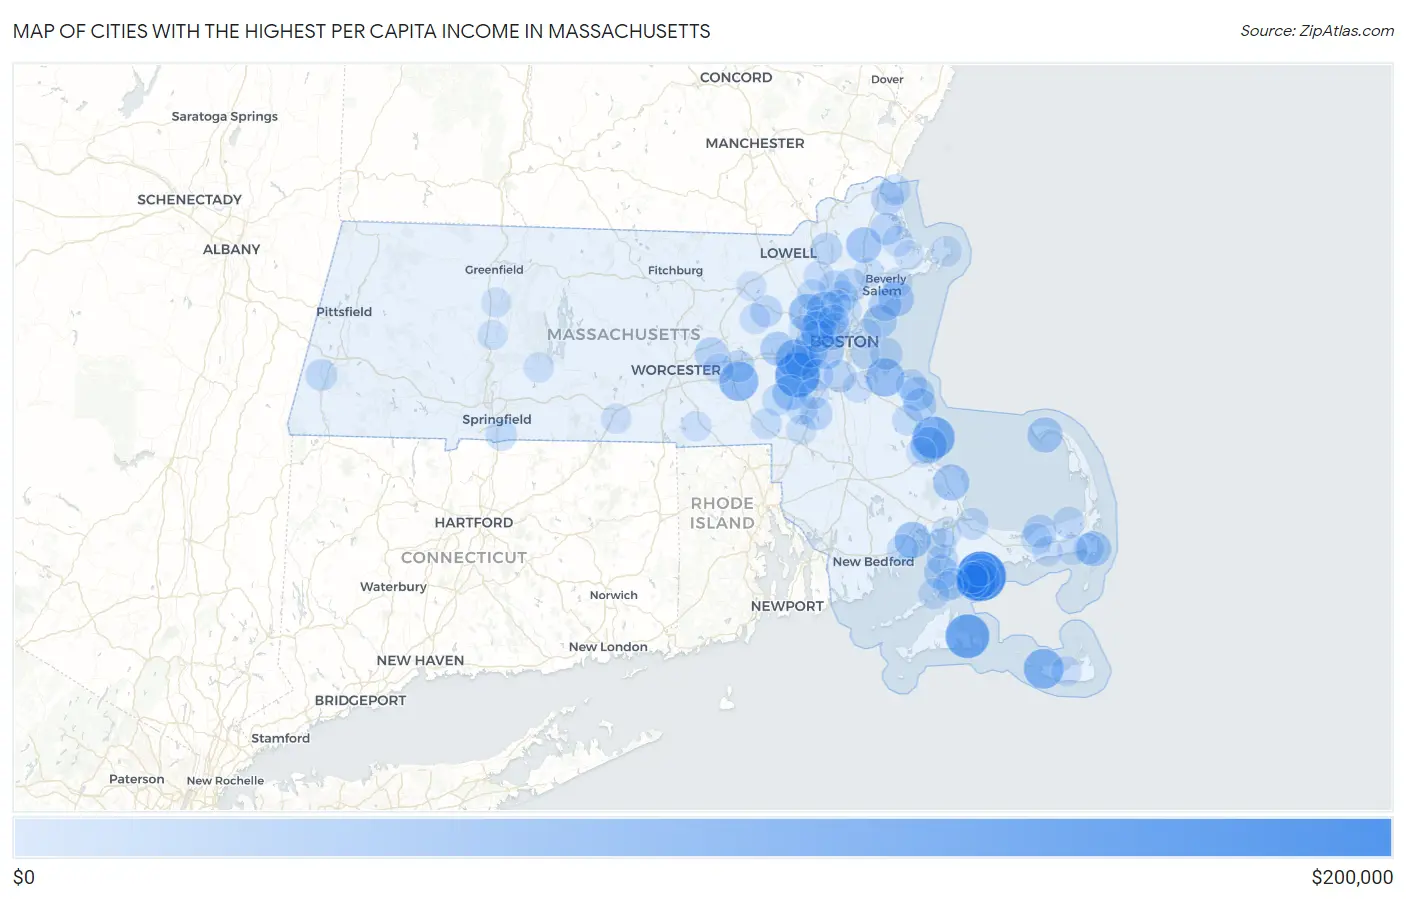
Map of Cities with the Highest Per Capita Income in Massachusetts
$0
$200,000
Cities with the Highest Per Capita Income in Massachusetts
| City | Per Capita Income | vs State | vs National | |
| 1. | Popponesset Island | $189,099 | $53,513(+136k)#1 | $41,261(+148k)#34 |
| 2. | Dover | $152,767 | $53,513(+99.3k)#2 | $41,261(+112k)#105 |
| 3. | Edgartown | $148,187 | $53,513(+94.7k)#3 | $41,261(+107k)#124 |
| 4. | Duxbury | $135,376 | $53,513(+81.9k)#4 | $41,261(+94.1k)#176 |
| 5. | Madaket | $121,426 | $53,513(+67.9k)#5 | $41,261(+80.2k)#263 |
| 6. | New Seabury | $119,584 | $53,513(+66.1k)#6 | $41,261(+78.3k)#277 |
| 7. | Hopkinton | $116,491 | $53,513(+63.0k)#7 | $41,261(+75.2k)#302 |
| 8. | Wellesley | $111,690 | $53,513(+58.2k)#8 | $41,261(+70.4k)#359 |
| 9. | Hingham | $108,872 | $53,513(+55.4k)#9 | $41,261(+67.6k)#388 |
| 10. | Popponesset | $107,889 | $53,513(+54.4k)#10 | $41,261(+66.6k)#401 |
| 11. | Lexington | $102,776 | $53,513(+49.3k)#11 | $41,261(+61.5k)#474 |
| 12. | Winchester | $100,383 | $53,513(+46.9k)#12 | $41,261(+59.1k)#515 |
| 13. | South Duxbury | $98,001 | $53,513(+44.5k)#13 | $41,261(+56.7k)#549 |
| 14. | Marion Center | $97,213 | $53,513(+43.7k)#14 | $41,261(+56.0k)#562 |
| 15. | The Pinehills | $95,431 | $53,513(+41.9k)#15 | $41,261(+54.2k)#588 |
| 16. | Needham | $95,376 | $53,513(+41.9k)#16 | $41,261(+54.1k)#589 |
| 17. | Boxford | $91,296 | $53,513(+37.8k)#17 | $41,261(+50.0k)#670 |
| 18. | Newton | $91,282 | $53,513(+37.8k)#18 | $41,261(+50.0k)#671 |
| 19. | Brookline | $91,184 | $53,513(+37.7k)#19 | $41,261(+49.9k)#673 |
| 20. | Marblehead | $90,921 | $53,513(+37.4k)#20 | $41,261(+49.7k)#678 |
| 21. | Provincetown | $89,577 | $53,513(+36.1k)#21 | $41,261(+48.3k)#711 |
| 22. | Medfield | $88,888 | $53,513(+35.4k)#22 | $41,261(+47.6k)#734 |
| 23. | Belmont | $88,841 | $53,513(+35.3k)#23 | $41,261(+47.6k)#735 |
| 24. | Chatham | $88,295 | $53,513(+34.8k)#24 | $41,261(+47.0k)#746 |
| 25. | Cochituate | $83,410 | $53,513(+29.9k)#25 | $41,261(+42.1k)#881 |
| 26. | West Falmouth | $83,057 | $53,513(+29.5k)#26 | $41,261(+41.8k)#899 |
| 27. | Scituate | $79,010 | $53,513(+25.5k)#27 | $41,261(+37.7k)#1,033 |
| 28. | Nahant | $78,467 | $53,513(+25.0k)#28 | $41,261(+37.2k)#1,063 |
| 29. | Arlington | $77,043 | $53,513(+23.5k)#29 | $41,261(+35.8k)#1,121 |
| 30. | Marshfield Hills | $76,373 | $53,513(+22.9k)#30 | $41,261(+35.1k)#1,149 |
| 31. | Northborough | $75,980 | $53,513(+22.5k)#31 | $41,261(+34.7k)#1,169 |
| 32. | Dennis | $74,784 | $53,513(+21.3k)#32 | $41,261(+33.5k)#1,228 |
| 33. | Monomoscoy Island | $74,563 | $53,513(+21.1k)#33 | $41,261(+33.3k)#1,239 |
| 34. | Newburyport | $73,247 | $53,513(+19.7k)#34 | $41,261(+32.0k)#1,305 |
| 35. | Lynnfield | $73,239 | $53,513(+19.7k)#35 | $41,261(+32.0k)#1,307 |
| 36. | Mashpee Neck | $73,051 | $53,513(+19.5k)#36 | $41,261(+31.8k)#1,324 |
| 37. | Cambridge | $72,975 | $53,513(+19.5k)#37 | $41,261(+31.7k)#1,329 |
| 38. | Swampscott | $72,512 | $53,513(+19.0k)#38 | $41,261(+31.3k)#1,349 |
| 39. | Sharon | $71,548 | $53,513(+18.0k)#39 | $41,261(+30.3k)#1,407 |
| 40. | Milton | $71,516 | $53,513(+18.0k)#40 | $41,261(+30.3k)#1,413 |
| 41. | Rowley | $70,283 | $53,513(+16.8k)#41 | $41,261(+29.0k)#1,496 |
| 42. | Hull | $69,609 | $53,513(+16.1k)#42 | $41,261(+28.3k)#1,537 |
| 43. | Watertown Town | $69,498 | $53,513(+16.0k)#43 | $41,261(+28.2k)#1,544 |
| 44. | Cordaville | $69,272 | $53,513(+15.8k)#44 | $41,261(+28.0k)#1,554 |
| 45. | Andover | $68,253 | $53,513(+14.7k)#45 | $41,261(+27.0k)#1,633 |
| 46. | West Concord | $67,907 | $53,513(+14.4k)#46 | $41,261(+26.6k)#1,663 |
| 47. | Reading | $66,745 | $53,513(+13.2k)#47 | $41,261(+25.5k)#1,756 |
| 48. | Housatonic | $66,455 | $53,513(+12.9k)#48 | $41,261(+25.2k)#1,794 |
| 49. | Brewster | $65,884 | $53,513(+12.4k)#49 | $41,261(+24.6k)#1,841 |
| 50. | North Falmouth | $65,831 | $53,513(+12.3k)#50 | $41,261(+24.6k)#1,848 |
| 51. | Sandwich | $65,470 | $53,513(+12.0k)#51 | $41,261(+24.2k)#1,870 |
| 52. | North Scituate | $65,395 | $53,513(+11.9k)#52 | $41,261(+24.1k)#1,877 |
| 53. | Dedham | $65,381 | $53,513(+11.9k)#53 | $41,261(+24.1k)#1,880 |
| 54. | Teaticket | $65,345 | $53,513(+11.8k)#54 | $41,261(+24.1k)#1,883 |
| 55. | Somerville | $65,100 | $53,513(+11.6k)#55 | $41,261(+23.8k)#1,906 |
| 56. | Wakefield | $64,988 | $53,513(+11.5k)#56 | $41,261(+23.7k)#1,916 |
| 57. | Walpole | $64,903 | $53,513(+11.4k)#57 | $41,261(+23.6k)#1,928 |
| 58. | Mattapoisett Center | $64,652 | $53,513(+11.1k)#58 | $41,261(+23.4k)#1,948 |
| 59. | Longmeadow | $64,358 | $53,513(+10.8k)#59 | $41,261(+23.1k)#1,974 |
| 60. | Millis Clicquot | $64,023 | $53,513(+10.5k)#60 | $41,261(+22.8k)#2,006 |
| 61. | Seabrook | $63,378 | $53,513(+9.87k)#61 | $41,261(+22.1k)#2,075 |
| 62. | Salisbury | $62,826 | $53,513(+9.31k)#62 | $41,261(+21.6k)#2,126 |
| 63. | Burlington | $62,805 | $53,513(+9.29k)#63 | $41,261(+21.5k)#2,129 |
| 64. | West Chatham | $62,581 | $53,513(+9.07k)#64 | $41,261(+21.3k)#2,146 |
| 65. | Yarmouth Port | $62,228 | $53,513(+8.71k)#65 | $41,261(+21.0k)#2,189 |
| 66. | Green Harbor | $61,902 | $53,513(+8.39k)#66 | $41,261(+20.6k)#2,233 |
| 67. | Franklin Town | $61,841 | $53,513(+8.33k)#67 | $41,261(+20.6k)#2,245 |
| 68. | Woods Hole | $61,806 | $53,513(+8.29k)#68 | $41,261(+20.5k)#2,251 |
| 69. | North Pembroke | $61,174 | $53,513(+7.66k)#69 | $41,261(+19.9k)#2,319 |
| 70. | Melrose | $60,957 | $53,513(+7.44k)#70 | $41,261(+19.7k)#2,345 |
| 71. | Rockport | $60,379 | $53,513(+6.87k)#71 | $41,261(+19.1k)#2,423 |
| 72. | Stoneham | $60,043 | $53,513(+6.53k)#72 | $41,261(+18.8k)#2,478 |
| 73. | Ipswich | $59,867 | $53,513(+6.35k)#73 | $41,261(+18.6k)#2,496 |
| 74. | Cedar Crest | $59,853 | $53,513(+6.34k)#74 | $41,261(+18.6k)#2,503 |
| 75. | Maynard | $59,516 | $53,513(+6.00k)#75 | $41,261(+18.3k)#2,552 |
| 76. | Norwood | $59,459 | $53,513(+5.95k)#76 | $41,261(+18.2k)#2,559 |
| 77. | Medford | $58,522 | $53,513(+5.01k)#77 | $41,261(+17.3k)#2,690 |
| 78. | Wilmington | $58,224 | $53,513(+4.71k)#78 | $41,261(+17.0k)#2,736 |
| 79. | Westborough | $58,215 | $53,513(+4.70k)#79 | $41,261(+17.0k)#2,739 |
| 80. | Harwich Port | $57,956 | $53,513(+4.44k)#80 | $41,261(+16.7k)#2,775 |
| 81. | Kingston | $57,631 | $53,513(+4.12k)#81 | $41,261(+16.4k)#2,835 |
| 82. | West Dennis | $57,302 | $53,513(+3.79k)#82 | $41,261(+16.0k)#2,872 |
| 83. | Winthrop Town | $57,278 | $53,513(+3.77k)#83 | $41,261(+16.0k)#2,873 |
| 84. | Nantucket | $56,829 | $53,513(+3.32k)#84 | $41,261(+15.6k)#2,936 |
| 85. | East Douglas | $56,772 | $53,513(+3.26k)#85 | $41,261(+15.5k)#2,942 |
| 86. | Sturbridge | $56,770 | $53,513(+3.26k)#86 | $41,261(+15.5k)#2,943 |
| 87. | Waltham | $56,716 | $53,513(+3.20k)#87 | $41,261(+15.5k)#2,947 |
| 88. | Foxborough | $56,635 | $53,513(+3.12k)#88 | $41,261(+15.4k)#2,960 |
| 89. | Pocasset | $56,615 | $53,513(+3.10k)#89 | $41,261(+15.4k)#2,963 |
| 90. | Braintree Town | $56,554 | $53,513(+3.04k)#90 | $41,261(+15.3k)#2,969 |
| 91. | Beverly | $56,102 | $53,513(+2.59k)#91 | $41,261(+14.8k)#3,037 |
| 92. | Boston | $55,949 | $53,513(+2.44k)#92 | $41,261(+14.7k)#3,063 |
| 93. | Danvers | $55,742 | $53,513(+2.23k)#93 | $41,261(+14.5k)#3,107 |
| 94. | Bourne | $55,732 | $53,513(+2.22k)#94 | $41,261(+14.5k)#3,110 |
| 95. | Essex | $55,647 | $53,513(+2.13k)#95 | $41,261(+14.4k)#3,123 |
| 96. | Belchertown | $55,609 | $53,513(+2.10k)#96 | $41,261(+14.3k)#3,128 |
| 97. | Falmouth | $55,259 | $53,513(+1.75k)#97 | $41,261(+14.0k)#3,188 |
| 98. | Littleton Common | $55,219 | $53,513(+1.71k)#98 | $41,261(+14.0k)#3,197 |
| 99. | South Deerfield | $55,175 | $53,513(+1.66k)#99 | $41,261(+13.9k)#3,208 |
| 100. | Hatfield | $54,952 | $53,513(+1.44k)#100 | $41,261(+13.7k)#3,248 |
Common Questions
What are the Top 10 Cities with the Highest Per Capita Income in Massachusetts?
Top 10 Cities with the Highest Per Capita Income in Massachusetts are:
#1
$189,099
#2
$152,767
#3
$148,187
#4
$135,376
#5
$121,426
#6
$119,584
#7
$116,491
#8
$111,690
#9
$108,872
#10
$107,889
What city has the Highest Per Capita Income in Massachusetts?
Popponesset Island has the Highest Per Capita Income in Massachusetts with $189,099.
What is the Per Capita Income in the State of Massachusetts?
Per Capita Income in Massachusetts is $53,513.
What is the Per Capita Income in the United States?
Per Capita Income in the United States is $41,261.