Cities with the Most Immigrants from Portugal in New York
RELATED REPORTS & OPTIONS
Portugal
New York
Compare Cities
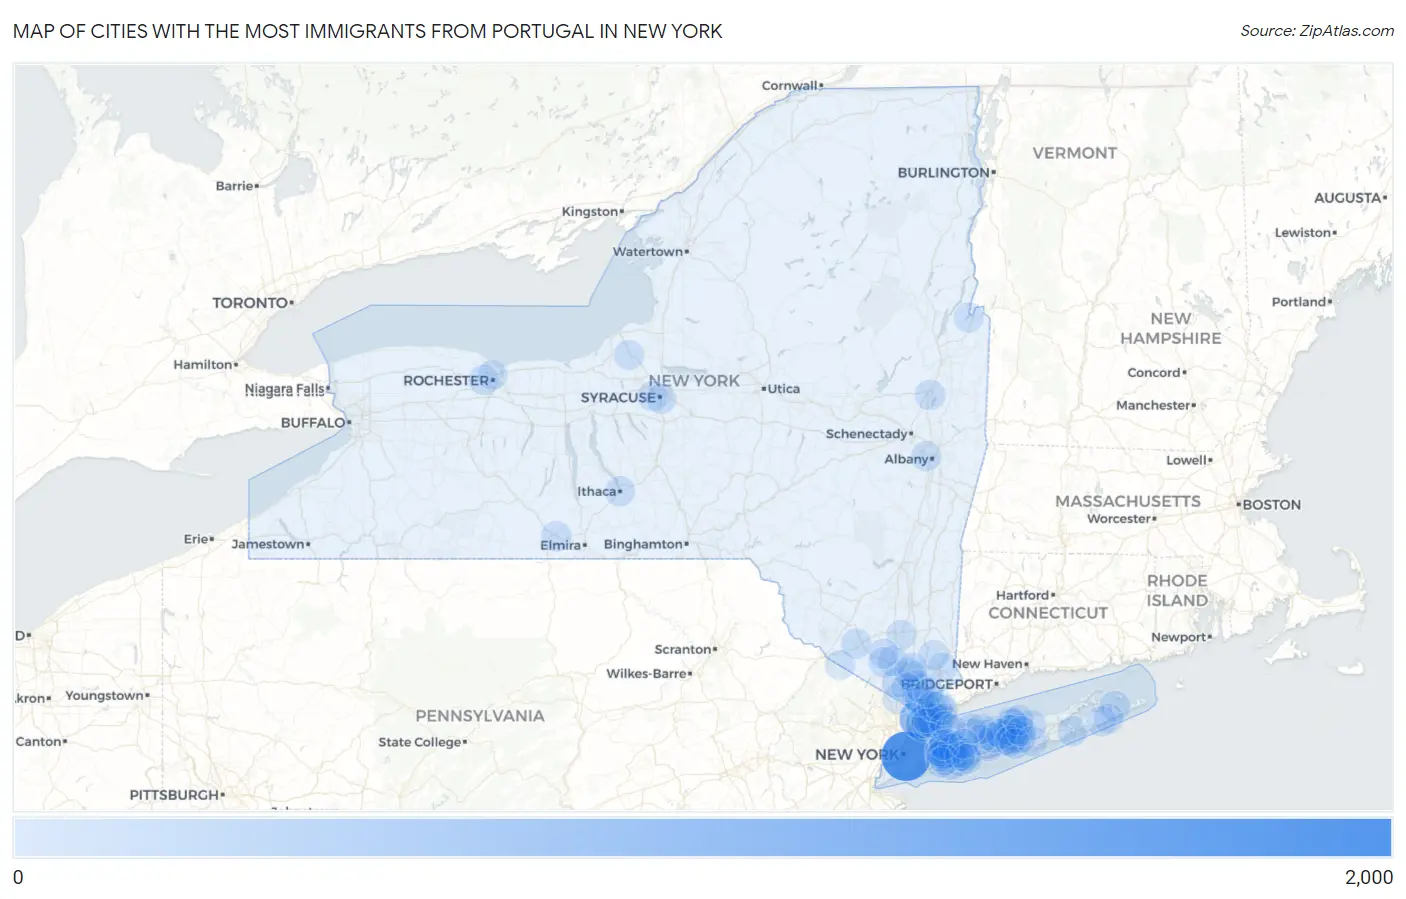
Map of Cities with the Most Immigrants from Portugal in New York
0
2,000
Cities with the Most Immigrants from Portugal in New York
| City | Portugal | vs State | vs National | |
| 1. | New York | 1,980 | 10,519(18.82%)#1 | 169,177(1.17%)#9 |
| 2. | Yonkers | 1,057 | 10,519(10.05%)#2 | 169,177(0.62%)#17 |
| 3. | Mineola | 940 | 10,519(8.94%)#3 | 169,177(0.56%)#20 |
| 4. | Mount Vernon | 590 | 10,519(5.61%)#4 | 169,177(0.35%)#36 |
| 5. | Mamaroneck | 477 | 10,519(4.53%)#5 | 169,177(0.28%)#44 |
| 6. | Farmingville | 259 | 10,519(2.46%)#6 | 169,177(0.15%)#77 |
| 7. | Freeport | 179 | 10,519(1.70%)#7 | 169,177(0.11%)#98 |
| 8. | New Rochelle | 172 | 10,519(1.64%)#8 | 169,177(0.10%)#101 |
| 9. | East Meadow | 161 | 10,519(1.53%)#9 | 169,177(0.10%)#117 |
| 10. | Ossining | 153 | 10,519(1.45%)#10 | 169,177(0.09%)#124 |
| 11. | Lake Ronkonkoma | 139 | 10,519(1.32%)#11 | 169,177(0.08%)#133 |
| 12. | Sleepy Hollow | 132 | 10,519(1.25%)#12 | 169,177(0.08%)#143 |
| 13. | Port Jefferson Station | 127 | 10,519(1.21%)#13 | 169,177(0.08%)#149 |
| 14. | Medford | 123 | 10,519(1.17%)#14 | 169,177(0.07%)#151 |
| 15. | Carle Place | 115 | 10,519(1.09%)#15 | 169,177(0.07%)#162 |
| 16. | Coram | 113 | 10,519(1.07%)#16 | 169,177(0.07%)#167 |
| 17. | Eastchester | 110 | 10,519(1.05%)#17 | 169,177(0.07%)#174 |
| 18. | Westbury | 102 | 10,519(0.97%)#18 | 169,177(0.06%)#185 |
| 19. | Selden | 95 | 10,519(0.90%)#19 | 169,177(0.06%)#198 |
| 20. | Ronkonkoma | 81 | 10,519(0.77%)#20 | 169,177(0.05%)#227 |
| 21. | Levittown | 75 | 10,519(0.71%)#21 | 169,177(0.04%)#234 |
| 22. | Williston Park | 71 | 10,519(0.67%)#22 | 169,177(0.04%)#247 |
| 23. | Garden City | 69 | 10,519(0.66%)#23 | 169,177(0.04%)#252 |
| 24. | Garden City Park | 59 | 10,519(0.56%)#24 | 169,177(0.03%)#299 |
| 25. | Springs | 58 | 10,519(0.55%)#25 | 169,177(0.03%)#307 |
| 26. | North Bay Shore | 48 | 10,519(0.46%)#26 | 169,177(0.03%)#361 |
| 27. | East Setauket | 47 | 10,519(0.45%)#27 | 169,177(0.03%)#369 |
| 28. | Corning | 45 | 10,519(0.43%)#28 | 169,177(0.03%)#387 |
| 29. | Harrison | 44 | 10,519(0.42%)#29 | 169,177(0.03%)#394 |
| 30. | Brentwood | 43 | 10,519(0.41%)#30 | 169,177(0.03%)#402 |
| 31. | Roslyn Heights | 43 | 10,519(0.41%)#31 | 169,177(0.03%)#409 |
| 32. | Huntington Station | 42 | 10,519(0.40%)#32 | 169,177(0.02%)#420 |
| 33. | Chestnut Ridge | 42 | 10,519(0.40%)#33 | 169,177(0.02%)#422 |
| 34. | Smithtown | 39 | 10,519(0.37%)#34 | 169,177(0.02%)#445 |
| 35. | Monroe | 38 | 10,519(0.36%)#35 | 169,177(0.02%)#459 |
| 36. | Fairview Cdp Dutchess County | 38 | 10,519(0.36%)#36 | 169,177(0.02%)#461 |
| 37. | Pomona | 37 | 10,519(0.35%)#37 | 169,177(0.02%)#470 |
| 38. | Garden City South | 36 | 10,519(0.34%)#38 | 169,177(0.02%)#476 |
| 39. | Saratoga Springs | 35 | 10,519(0.33%)#39 | 169,177(0.02%)#480 |
| 40. | Carmel | 35 | 10,519(0.33%)#40 | 169,177(0.02%)#489 |
| 41. | Gates | 35 | 10,519(0.33%)#41 | 169,177(0.02%)#493 |
| 42. | Ridge | 34 | 10,519(0.32%)#42 | 169,177(0.02%)#497 |
| 43. | Middletown | 33 | 10,519(0.31%)#43 | 169,177(0.02%)#507 |
| 44. | Hicksville | 31 | 10,519(0.29%)#44 | 169,177(0.02%)#526 |
| 45. | Commack | 31 | 10,519(0.29%)#45 | 169,177(0.02%)#528 |
| 46. | Dix Hills | 31 | 10,519(0.29%)#46 | 169,177(0.02%)#532 |
| 47. | Wantagh | 31 | 10,519(0.29%)#47 | 169,177(0.02%)#533 |
| 48. | Sagaponack | 30 | 10,519(0.29%)#48 | 169,177(0.02%)#549 |
| 49. | Terryville | 29 | 10,519(0.28%)#49 | 169,177(0.02%)#561 |
| 50. | East Northport | 28 | 10,519(0.27%)#50 | 169,177(0.02%)#583 |
| 51. | New Hyde Park | 28 | 10,519(0.27%)#51 | 169,177(0.02%)#587 |
| 52. | Centereach | 27 | 10,519(0.26%)#52 | 169,177(0.02%)#595 |
| 53. | Hampton Bays | 25 | 10,519(0.24%)#53 | 169,177(0.01%)#642 |
| 54. | Salisbury | 25 | 10,519(0.24%)#54 | 169,177(0.01%)#643 |
| 55. | Hauppauge | 24 | 10,519(0.23%)#55 | 169,177(0.01%)#663 |
| 56. | Holtsville | 24 | 10,519(0.23%)#56 | 169,177(0.01%)#664 |
| 57. | Ithaca | 23 | 10,519(0.22%)#57 | 169,177(0.01%)#676 |
| 58. | Nesconset | 23 | 10,519(0.22%)#58 | 169,177(0.01%)#681 |
| 59. | Rye | 22 | 10,519(0.21%)#59 | 169,177(0.01%)#695 |
| 60. | Holbrook | 21 | 10,519(0.20%)#60 | 169,177(0.01%)#714 |
| 61. | Tarrytown | 21 | 10,519(0.20%)#61 | 169,177(0.01%)#716 |
| 62. | Miller Place | 20 | 10,519(0.19%)#62 | 169,177(0.01%)#743 |
| 63. | Pelham | 20 | 10,519(0.19%)#63 | 169,177(0.01%)#745 |
| 64. | North Patchogue | 19 | 10,519(0.18%)#64 | 169,177(0.01%)#772 |
| 65. | Port Chester | 18 | 10,519(0.17%)#65 | 169,177(0.01%)#786 |
| 66. | Briarcliff Manor | 18 | 10,519(0.17%)#66 | 169,177(0.01%)#796 |
| 67. | Solvay | 18 | 10,519(0.17%)#67 | 169,177(0.01%)#798 |
| 68. | Albany | 17 | 10,519(0.16%)#68 | 169,177(0.01%)#808 |
| 69. | White Plains | 17 | 10,519(0.16%)#69 | 169,177(0.01%)#810 |
| 70. | Franklin Square | 17 | 10,519(0.16%)#70 | 169,177(0.01%)#816 |
| 71. | Lynbrook | 16 | 10,519(0.15%)#71 | 169,177(0.01%)#848 |
| 72. | Mahopac | 16 | 10,519(0.15%)#72 | 169,177(0.01%)#856 |
| 73. | Newburgh | 15 | 10,519(0.14%)#73 | 169,177(0.01%)#879 |
| 74. | Shirley | 15 | 10,519(0.14%)#74 | 169,177(0.01%)#880 |
| 75. | South Farmingdale | 15 | 10,519(0.14%)#75 | 169,177(0.01%)#884 |
| 76. | Crugers | 15 | 10,519(0.14%)#76 | 169,177(0.01%)#900 |
| 77. | Verplanck | 15 | 10,519(0.14%)#77 | 169,177(0.01%)#901 |
| 78. | New City | 14 | 10,519(0.13%)#78 | 169,177(0.01%)#915 |
| 79. | Peekskill | 14 | 10,519(0.13%)#79 | 169,177(0.01%)#919 |
| 80. | Woodbury | 14 | 10,519(0.13%)#80 | 169,177(0.01%)#923 |
| 81. | Gordon Heights | 14 | 10,519(0.13%)#81 | 169,177(0.01%)#931 |
| 82. | North Massapequa | 13 | 10,519(0.12%)#82 | 169,177(0.01%)#951 |
| 83. | North Wantagh | 13 | 10,519(0.12%)#83 | 169,177(0.01%)#956 |
| 84. | Rye Brook | 13 | 10,519(0.12%)#84 | 169,177(0.01%)#958 |
| 85. | Whitehall | 13 | 10,519(0.12%)#85 | 169,177(0.01%)#966 |
| 86. | Glen Cove | 12 | 10,519(0.11%)#86 | 169,177(0.01%)#980 |
| 87. | Locust Valley | 12 | 10,519(0.11%)#87 | 169,177(0.01%)#1,000 |
| 88. | East Hampton | 12 | 10,519(0.11%)#88 | 169,177(0.01%)#1,005 |
| 89. | Unionville | 12 | 10,519(0.11%)#89 | 169,177(0.01%)#1,006 |
| 90. | Rockville Centre | 11 | 10,519(0.10%)#90 | 169,177(0.01%)#1,025 |
| 91. | Huntington | 11 | 10,519(0.10%)#91 | 169,177(0.01%)#1,028 |
| 92. | Fulton | 11 | 10,519(0.10%)#92 | 169,177(0.01%)#1,035 |
| 93. | Albertson | 11 | 10,519(0.10%)#93 | 169,177(0.01%)#1,042 |
| 94. | Thornwood | 11 | 10,519(0.10%)#94 | 169,177(0.01%)#1,045 |
| 95. | Golden S Bridge | 11 | 10,519(0.10%)#95 | 169,177(0.01%)#1,050 |
| 96. | Plainview | 10 | 10,519(0.10%)#96 | 169,177(0.01%)#1,081 |
| 97. | East Massapequa | 10 | 10,519(0.10%)#97 | 169,177(0.01%)#1,087 |
| 98. | South Blooming Grove | 10 | 10,519(0.10%)#98 | 169,177(0.01%)#1,108 |
| 99. | Rochester | 9 | 10,519(0.09%)#99 | 169,177(0.01%)#1,113 |
| 100. | Syracuse | 9 | 10,519(0.09%)#100 | 169,177(0.01%)#1,116 |
Common Questions
What are the Top 10 Cities with the Most Immigrants from Portugal in New York?
Top 10 Cities with the Most Immigrants from Portugal in New York are:
#1
1,980
#2
1,057
#3
940
#4
590
#5
477
#6
259
#7
179
#8
172
#9
161
#10
153
What city has the Most Immigrants from Portugal in New York?
New York has the Most Immigrants from Portugal in New York with 1,980.
What is the Total Immigrants from Portugal in the State of New York?
Total Immigrants from Portugal in New York is 10,519.
What is the Total Immigrants from Portugal in the United States?
Total Immigrants from Portugal in the United States is 169,177.