Cities with the Most Immigrants from Guyana in Pennsylvania
RELATED REPORTS & OPTIONS
Guyana
Pennsylvania
Compare Cities
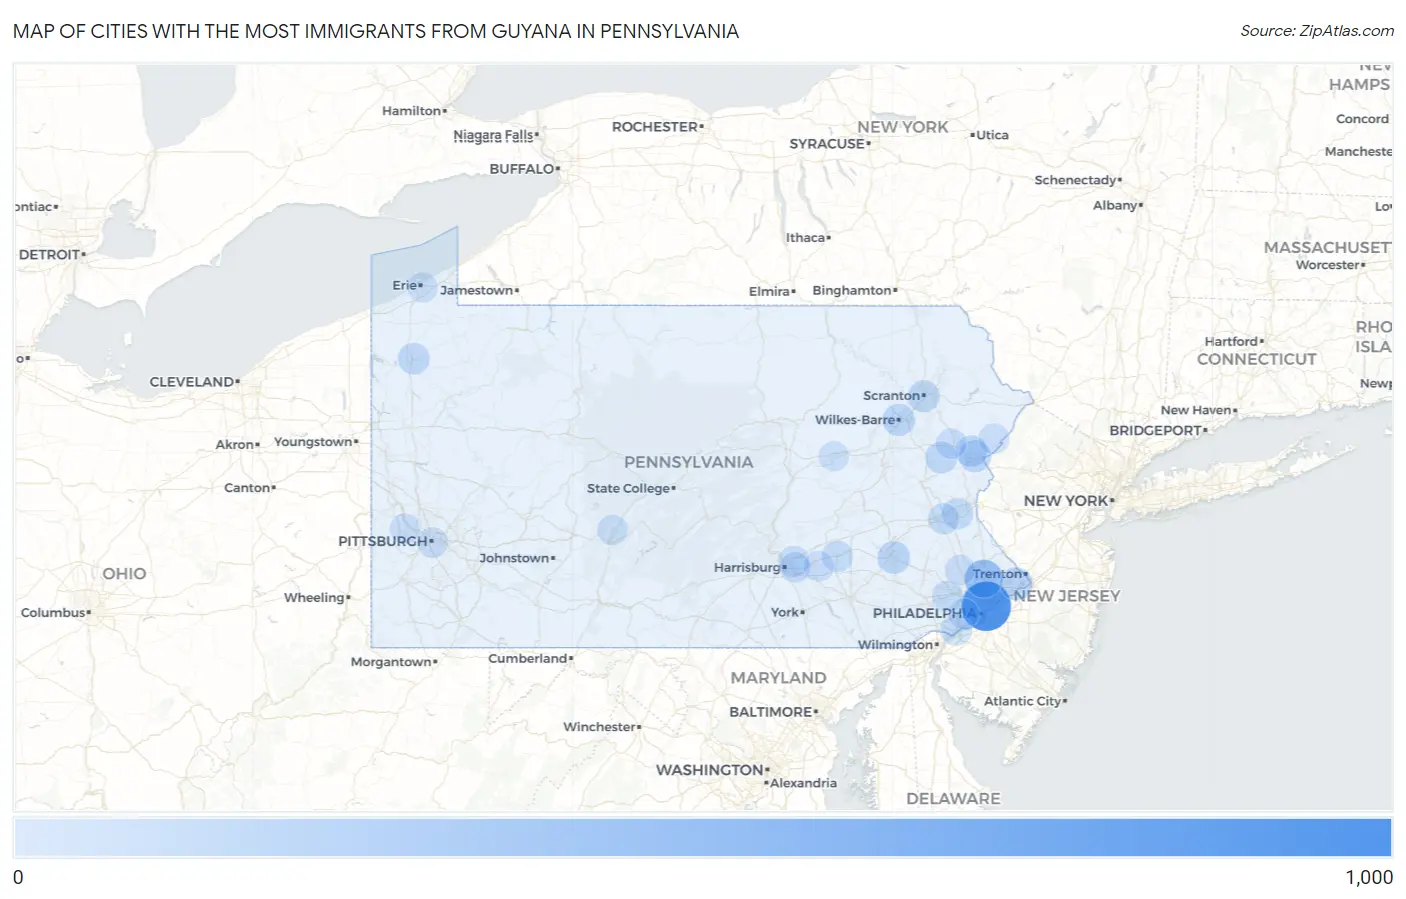
Map of Cities with the Most Immigrants from Guyana in Pennsylvania
0
1,000
Cities with the Most Immigrants from Guyana in Pennsylvania
| City | Guyana | vs State | vs National | |
| 1. | Philadelphia | 889 | 4,519(19.67%)#1 | 287,198(0.31%)#13 |
| 2. | Horsham | 354 | 4,519(7.83%)#2 | 287,198(0.12%)#54 |
| 3. | Levittown | 121 | 4,519(2.68%)#3 | 287,198(0.04%)#209 |
| 4. | Reading | 106 | 4,519(2.35%)#4 | 287,198(0.04%)#248 |
| 5. | Wilkes Barre | 90 | 4,519(1.99%)#5 | 287,198(0.03%)#282 |
| 6. | Arlington Heights | 87 | 4,519(1.93%)#6 | 287,198(0.03%)#287 |
| 7. | Scranton | 76 | 4,519(1.68%)#7 | 287,198(0.03%)#319 |
| 8. | Indian Mountain Lake | 74 | 4,519(1.64%)#8 | 287,198(0.03%)#334 |
| 9. | Penn Estates | 71 | 4,519(1.57%)#9 | 287,198(0.02%)#352 |
| 10. | Wilkinsburg Borough | 69 | 4,519(1.53%)#10 | 287,198(0.02%)#365 |
| 11. | Meadville | 69 | 4,519(1.53%)#11 | 287,198(0.02%)#366 |
| 12. | Chester | 53 | 4,519(1.17%)#12 | 287,198(0.02%)#449 |
| 13. | Bethlehem | 50 | 4,519(1.11%)#13 | 287,198(0.02%)#463 |
| 14. | Lebanon | 45 | 4,519(1.00%)#14 | 287,198(0.02%)#510 |
| 15. | Chesterbrook | 43 | 4,519(0.95%)#15 | 287,198(0.01%)#542 |
| 16. | Allentown | 39 | 4,519(0.86%)#16 | 287,198(0.01%)#571 |
| 17. | Wilson Borough | 39 | 4,519(0.86%)#17 | 287,198(0.01%)#577 |
| 18. | Colonial Park | 36 | 4,519(0.80%)#18 | 287,198(0.01%)#597 |
| 19. | Ephrata Borough | 34 | 4,519(0.75%)#19 | 287,198(0.01%)#625 |
| 20. | Pittsburgh | 29 | 4,519(0.64%)#20 | 287,198(0.01%)#675 |
| 21. | Lawnton | 26 | 4,519(0.58%)#21 | 287,198(0.01%)#736 |
| 22. | Wyomissing Borough | 24 | 4,519(0.53%)#22 | 287,198(0.01%)#769 |
| 23. | Milton Borough | 22 | 4,519(0.49%)#23 | 287,198(0.01%)#809 |
| 24. | Emerald Lakes | 21 | 4,519(0.46%)#24 | 287,198(0.01%)#834 |
| 25. | Mount Pocono Borough | 21 | 4,519(0.46%)#25 | 287,198(0.01%)#835 |
| 26. | Norristown Borough | 20 | 4,519(0.44%)#26 | 287,198(0.01%)#850 |
| 27. | Freemansburg Borough | 20 | 4,519(0.44%)#27 | 287,198(0.01%)#863 |
| 28. | Campbelltown | 19 | 4,519(0.42%)#28 | 287,198(0.01%)#889 |
| 29. | Saw Creek | 19 | 4,519(0.42%)#29 | 287,198(0.01%)#892 |
| 30. | East Lansdowne Borough | 18 | 4,519(0.40%)#30 | 287,198(0.01%)#919 |
| 31. | Carnot Moon | 17 | 4,519(0.38%)#31 | 287,198(0.01%)#939 |
| 32. | Altoona | 15 | 4,519(0.33%)#32 | 287,198(0.01%)#974 |
| 33. | Bath Borough | 15 | 4,519(0.33%)#33 | 287,198(0.01%)#990 |
| 34. | Drexel Hill | 12 | 4,519(0.27%)#34 | 287,198(0.00%)#1,061 |
| 35. | New Cumberland Borough | 12 | 4,519(0.27%)#35 | 287,198(0.00%)#1,075 |
| 36. | Kulpsville | 10 | 4,519(0.22%)#36 | 287,198(0.00%)#1,148 |
| 37. | Elverson Borough | 8 | 4,519(0.18%)#37 | 287,198(0.00%)#1,234 |
| 38. | Kingston Borough | 7 | 4,519(0.15%)#38 | 287,198(0.00%)#1,259 |
| 39. | Sayre Borough | 7 | 4,519(0.15%)#39 | 287,198(0.00%)#1,265 |
| 40. | South Greensburg Borough | 7 | 4,519(0.15%)#40 | 287,198(0.00%)#1,273 |
| 41. | Penndel Borough | 6 | 4,519(0.13%)#41 | 287,198(0.00%)#1,312 |
| 42. | Erie | 5 | 4,519(0.11%)#42 | 287,198(0.00%)#1,320 |
| 43. | West Grove Borough | 5 | 4,519(0.11%)#43 | 287,198(0.00%)#1,339 |
| 44. | Evans City Borough | 4 | 4,519(0.09%)#44 | 287,198(0.00%)#1,369 |
| 45. | Bloomsburg | 3 | 4,519(0.07%)#45 | 287,198(0.00%)#1,383 |
| 46. | Robesonia Borough | 3 | 4,519(0.07%)#46 | 287,198(0.00%)#1,393 |
| 47. | Wernersville Borough | 2 | 4,519(0.04%)#47 | 287,198(0.00%)#1,418 |
Common Questions
What are the Top 10 Cities with the Most Immigrants from Guyana in Pennsylvania?
Top 10 Cities with the Most Immigrants from Guyana in Pennsylvania are:
#1
889
#2
354
#3
121
#4
106
#5
90
#6
87
#7
76
#8
74
#9
71
#10
69
What city has the Most Immigrants from Guyana in Pennsylvania?
Philadelphia has the Most Immigrants from Guyana in Pennsylvania with 889.
What is the Total Immigrants from Guyana in the State of Pennsylvania?
Total Immigrants from Guyana in Pennsylvania is 4,519.
What is the Total Immigrants from Guyana in the United States?
Total Immigrants from Guyana in the United States is 287,198.