Cities with the Most Immigrants from Canada in Massachusetts
RELATED REPORTS & OPTIONS
Canada
Massachusetts
Compare Cities
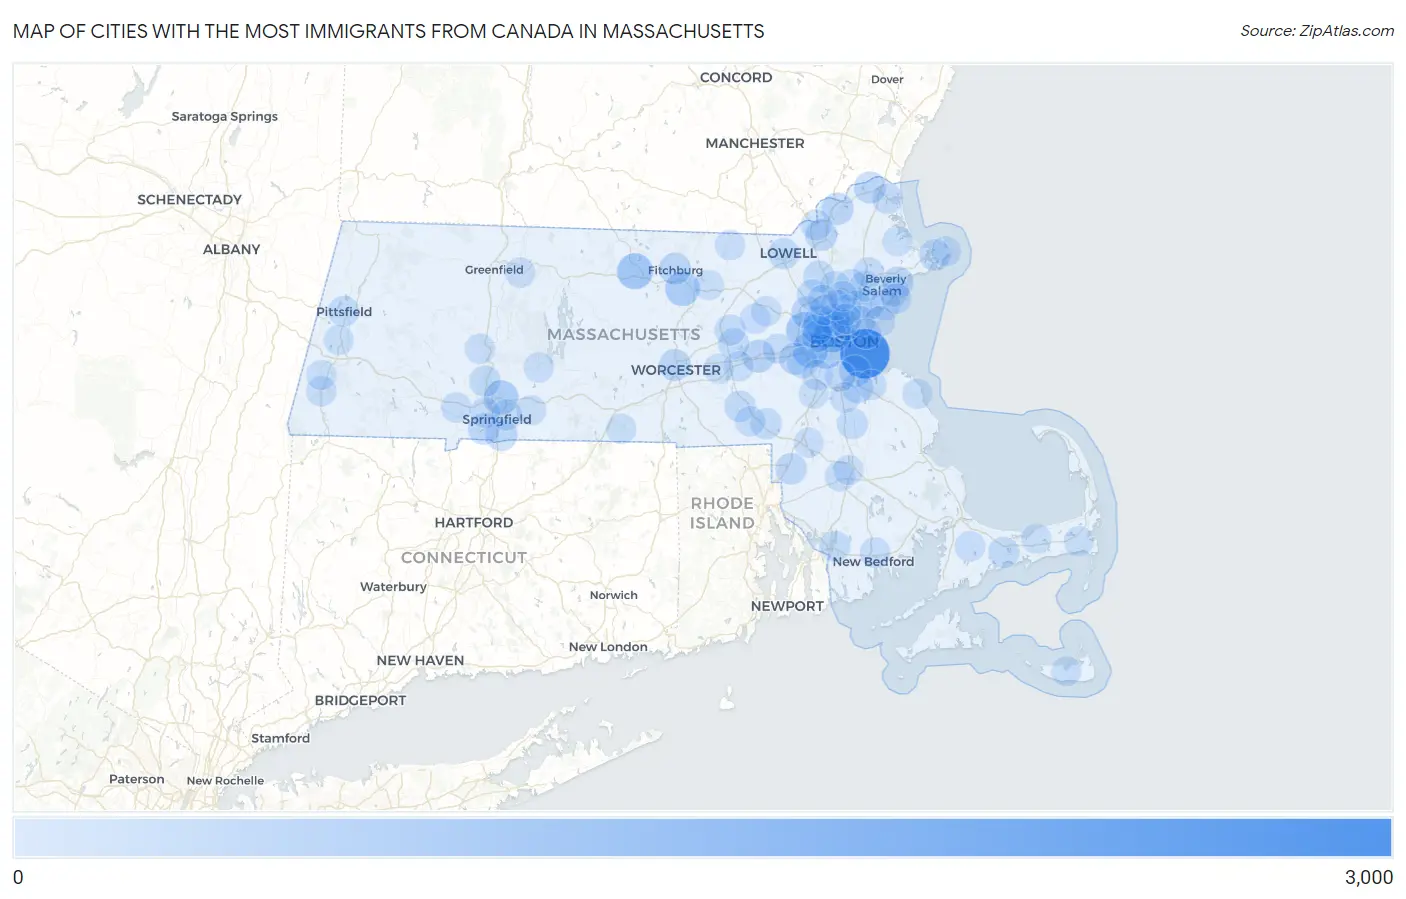
Map of Cities with the Most Immigrants from Canada in Massachusetts
0
3,000
Cities with the Most Immigrants from Canada in Massachusetts
| City | Canada | vs State | vs National | |
| 1. | Boston | 2,584 | 28,158(9.18%)#1 | 821,792(0.31%)#14 |
| 2. | Somerville | 958 | 28,158(3.40%)#2 | 821,792(0.12%)#75 |
| 3. | Cambridge | 920 | 28,158(3.27%)#3 | 821,792(0.11%)#80 |
| 4. | Gardner | 764 | 28,158(2.71%)#4 | 821,792(0.09%)#112 |
| 5. | Newton | 694 | 28,158(2.46%)#5 | 821,792(0.08%)#137 |
| 6. | Waltham | 684 | 28,158(2.43%)#6 | 821,792(0.08%)#142 |
| 7. | Brookline | 639 | 28,158(2.27%)#7 | 821,792(0.08%)#151 |
| 8. | Leominster | 582 | 28,158(2.07%)#8 | 821,792(0.07%)#171 |
| 9. | Chicopee | 547 | 28,158(1.94%)#9 | 821,792(0.07%)#189 |
| 10. | Arlington | 407 | 28,158(1.45%)#10 | 821,792(0.05%)#283 |
| 11. | Framingham | 361 | 28,158(1.28%)#11 | 821,792(0.04%)#329 |
| 12. | Lexington | 320 | 28,158(1.14%)#12 | 821,792(0.04%)#377 |
| 13. | Haverhill | 286 | 28,158(1.02%)#13 | 821,792(0.03%)#435 |
| 14. | Fitchburg | 273 | 28,158(0.97%)#14 | 821,792(0.03%)#449 |
| 15. | Worcester | 269 | 28,158(0.96%)#15 | 821,792(0.03%)#457 |
| 16. | Medford | 267 | 28,158(0.95%)#16 | 821,792(0.03%)#463 |
| 17. | Longmeadow | 266 | 28,158(0.94%)#17 | 821,792(0.03%)#465 |
| 18. | Quincy | 262 | 28,158(0.93%)#18 | 821,792(0.03%)#477 |
| 19. | Amesbury Town | 243 | 28,158(0.86%)#19 | 821,792(0.03%)#527 |
| 20. | Lawrence | 241 | 28,158(0.86%)#20 | 821,792(0.03%)#531 |
| 21. | Wellesley | 240 | 28,158(0.85%)#21 | 821,792(0.03%)#536 |
| 22. | Beverly | 238 | 28,158(0.85%)#22 | 821,792(0.03%)#543 |
| 23. | Agawam Town | 231 | 28,158(0.82%)#23 | 821,792(0.03%)#567 |
| 24. | Lynn | 226 | 28,158(0.80%)#24 | 821,792(0.03%)#579 |
| 25. | Gloucester | 202 | 28,158(0.72%)#25 | 821,792(0.02%)#651 |
| 26. | Attleboro | 199 | 28,158(0.71%)#26 | 821,792(0.02%)#656 |
| 27. | Braintree Town | 197 | 28,158(0.70%)#27 | 821,792(0.02%)#660 |
| 28. | Watertown Town | 196 | 28,158(0.70%)#28 | 821,792(0.02%)#664 |
| 29. | Wilmington | 188 | 28,158(0.67%)#29 | 821,792(0.02%)#693 |
| 30. | Milford | 183 | 28,158(0.65%)#30 | 821,792(0.02%)#715 |
| 31. | Belmont | 181 | 28,158(0.64%)#31 | 821,792(0.02%)#721 |
| 32. | Holyoke | 180 | 28,158(0.64%)#32 | 821,792(0.02%)#723 |
| 33. | Burlington | 174 | 28,158(0.62%)#33 | 821,792(0.02%)#743 |
| 34. | Lynnfield | 169 | 28,158(0.60%)#34 | 821,792(0.02%)#760 |
| 35. | Franklin Town | 168 | 28,158(0.60%)#35 | 821,792(0.02%)#763 |
| 36. | Lowell | 163 | 28,158(0.58%)#36 | 821,792(0.02%)#782 |
| 37. | Barnstable Town | 163 | 28,158(0.58%)#37 | 821,792(0.02%)#786 |
| 38. | Needham | 158 | 28,158(0.56%)#38 | 821,792(0.02%)#810 |
| 39. | Saugus | 158 | 28,158(0.56%)#39 | 821,792(0.02%)#812 |
| 40. | Marlborough | 150 | 28,158(0.53%)#40 | 821,792(0.02%)#861 |
| 41. | Peabody | 146 | 28,158(0.52%)#41 | 821,792(0.02%)#889 |
| 42. | Hudson | 145 | 28,158(0.51%)#42 | 821,792(0.02%)#894 |
| 43. | Springfield | 139 | 28,158(0.49%)#43 | 821,792(0.02%)#932 |
| 44. | Brockton | 138 | 28,158(0.49%)#44 | 821,792(0.02%)#937 |
| 45. | Methuen Town | 134 | 28,158(0.48%)#45 | 821,792(0.02%)#964 |
| 46. | Fall River | 132 | 28,158(0.47%)#46 | 821,792(0.02%)#973 |
| 47. | Pittsfield | 132 | 28,158(0.47%)#47 | 821,792(0.02%)#976 |
| 48. | Revere | 114 | 28,158(0.40%)#48 | 821,792(0.01%)#1,125 |
| 49. | Amherst | 107 | 28,158(0.38%)#49 | 821,792(0.01%)#1,189 |
| 50. | Danvers | 106 | 28,158(0.38%)#50 | 821,792(0.01%)#1,206 |
| 51. | Newburyport | 101 | 28,158(0.36%)#51 | 821,792(0.01%)#1,258 |
| 52. | Reading | 100 | 28,158(0.36%)#52 | 821,792(0.01%)#1,267 |
| 53. | West Springfield Town | 99 | 28,158(0.35%)#53 | 821,792(0.01%)#1,282 |
| 54. | Weymouth Town | 94 | 28,158(0.33%)#54 | 821,792(0.01%)#1,328 |
| 55. | Swampscott | 93 | 28,158(0.33%)#55 | 821,792(0.01%)#1,347 |
| 56. | Melrose | 92 | 28,158(0.33%)#56 | 821,792(0.01%)#1,354 |
| 57. | Winchester | 92 | 28,158(0.33%)#57 | 821,792(0.01%)#1,355 |
| 58. | Great Barrington | 85 | 28,158(0.30%)#58 | 821,792(0.01%)#1,459 |
| 59. | Salem | 84 | 28,158(0.30%)#59 | 821,792(0.01%)#1,462 |
| 60. | Randolph Town | 81 | 28,158(0.29%)#60 | 821,792(0.01%)#1,505 |
| 61. | Marblehead | 80 | 28,158(0.28%)#61 | 821,792(0.01%)#1,534 |
| 62. | Westfield | 79 | 28,158(0.28%)#62 | 821,792(0.01%)#1,545 |
| 63. | Everett | 77 | 28,158(0.27%)#63 | 821,792(0.01%)#1,577 |
| 64. | New Bedford | 76 | 28,158(0.27%)#64 | 821,792(0.01%)#1,589 |
| 65. | Dedham | 74 | 28,158(0.26%)#65 | 821,792(0.01%)#1,622 |
| 66. | Stoneham | 74 | 28,158(0.26%)#66 | 821,792(0.01%)#1,624 |
| 67. | North Attleborough | 73 | 28,158(0.26%)#67 | 821,792(0.01%)#1,645 |
| 68. | Milton | 71 | 28,158(0.25%)#68 | 821,792(0.01%)#1,675 |
| 69. | Malden | 70 | 28,158(0.25%)#69 | 821,792(0.01%)#1,692 |
| 70. | Woburn | 70 | 28,158(0.25%)#70 | 821,792(0.01%)#1,693 |
| 71. | Taunton | 69 | 28,158(0.25%)#71 | 821,792(0.01%)#1,707 |
| 72. | Bellingham | 67 | 28,158(0.24%)#72 | 821,792(0.01%)#1,767 |
| 73. | Wakefield | 65 | 28,158(0.23%)#73 | 821,792(0.01%)#1,797 |
| 74. | Forestdale | 65 | 28,158(0.23%)#74 | 821,792(0.01%)#1,805 |
| 75. | Northampton | 61 | 28,158(0.22%)#75 | 821,792(0.01%)#1,879 |
| 76. | Nahant | 61 | 28,158(0.22%)#76 | 821,792(0.01%)#1,897 |
| 77. | Maynard | 55 | 28,158(0.20%)#77 | 821,792(0.01%)#2,019 |
| 78. | Winthrop Town | 52 | 28,158(0.18%)#78 | 821,792(0.01%)#2,101 |
| 79. | Scituate | 52 | 28,158(0.18%)#79 | 821,792(0.01%)#2,123 |
| 80. | Greenfield | 47 | 28,158(0.17%)#80 | 821,792(0.01%)#2,247 |
| 81. | West Concord | 47 | 28,158(0.17%)#81 | 821,792(0.01%)#2,259 |
| 82. | Shirley | 46 | 28,158(0.16%)#82 | 821,792(0.01%)#2,311 |
| 83. | East Pepperell | 38 | 28,158(0.13%)#83 | 821,792(0.00%)#2,640 |
| 84. | Southbridge Town | 37 | 28,158(0.13%)#84 | 821,792(0.00%)#2,665 |
| 85. | East Harwich | 37 | 28,158(0.13%)#85 | 821,792(0.00%)#2,683 |
| 86. | Ipswich | 37 | 28,158(0.13%)#86 | 821,792(0.00%)#2,688 |
| 87. | Belchertown | 36 | 28,158(0.13%)#87 | 821,792(0.00%)#2,740 |
| 88. | Lenox | 36 | 28,158(0.13%)#88 | 821,792(0.00%)#2,746 |
| 89. | Cordaville | 34 | 28,158(0.12%)#89 | 821,792(0.00%)#2,837 |
| 90. | Cochituate | 33 | 28,158(0.12%)#90 | 821,792(0.00%)#2,886 |
| 91. | Raynham Center | 31 | 28,158(0.11%)#91 | 821,792(0.00%)#3,016 |
| 92. | Westborough | 31 | 28,158(0.11%)#92 | 821,792(0.00%)#3,018 |
| 93. | Housatonic | 30 | 28,158(0.11%)#93 | 821,792(0.00%)#3,083 |
| 94. | Nantucket | 29 | 28,158(0.10%)#94 | 821,792(0.00%)#3,115 |
| 95. | Wilbraham | 29 | 28,158(0.10%)#95 | 821,792(0.00%)#3,136 |
| 96. | Rockport | 28 | 28,158(0.10%)#96 | 821,792(0.00%)#3,185 |
| 97. | Norwood | 27 | 28,158(0.10%)#97 | 821,792(0.00%)#3,217 |
| 98. | Yarmouth Port | 26 | 28,158(0.09%)#98 | 821,792(0.00%)#3,312 |
| 99. | Millers Falls | 26 | 28,158(0.09%)#99 | 821,792(0.00%)#3,339 |
| 100. | Mansfield Center | 25 | 28,158(0.09%)#100 | 821,792(0.00%)#3,380 |
Common Questions
What are the Top 10 Cities with the Most Immigrants from Canada in Massachusetts?
Top 10 Cities with the Most Immigrants from Canada in Massachusetts are:
#1
2,584
#2
958
#3
920
#4
764
#5
694
#6
684
#7
639
#8
582
#9
547
#10
407
What city has the Most Immigrants from Canada in Massachusetts?
Boston has the Most Immigrants from Canada in Massachusetts with 2,584.
What is the Total Immigrants from Canada in the State of Massachusetts?
Total Immigrants from Canada in Massachusetts is 28,158.
What is the Total Immigrants from Canada in the United States?
Total Immigrants from Canada in the United States is 821,792.