Cities with the Highest Percentage of Malaysian Population in the United States
RELATED REPORTS & OPTIONS
Malaysian
United States
Compare Cities
Map of Cities with the Highest Percentage of Malaysian Population in the United States
0.00%
25.00%
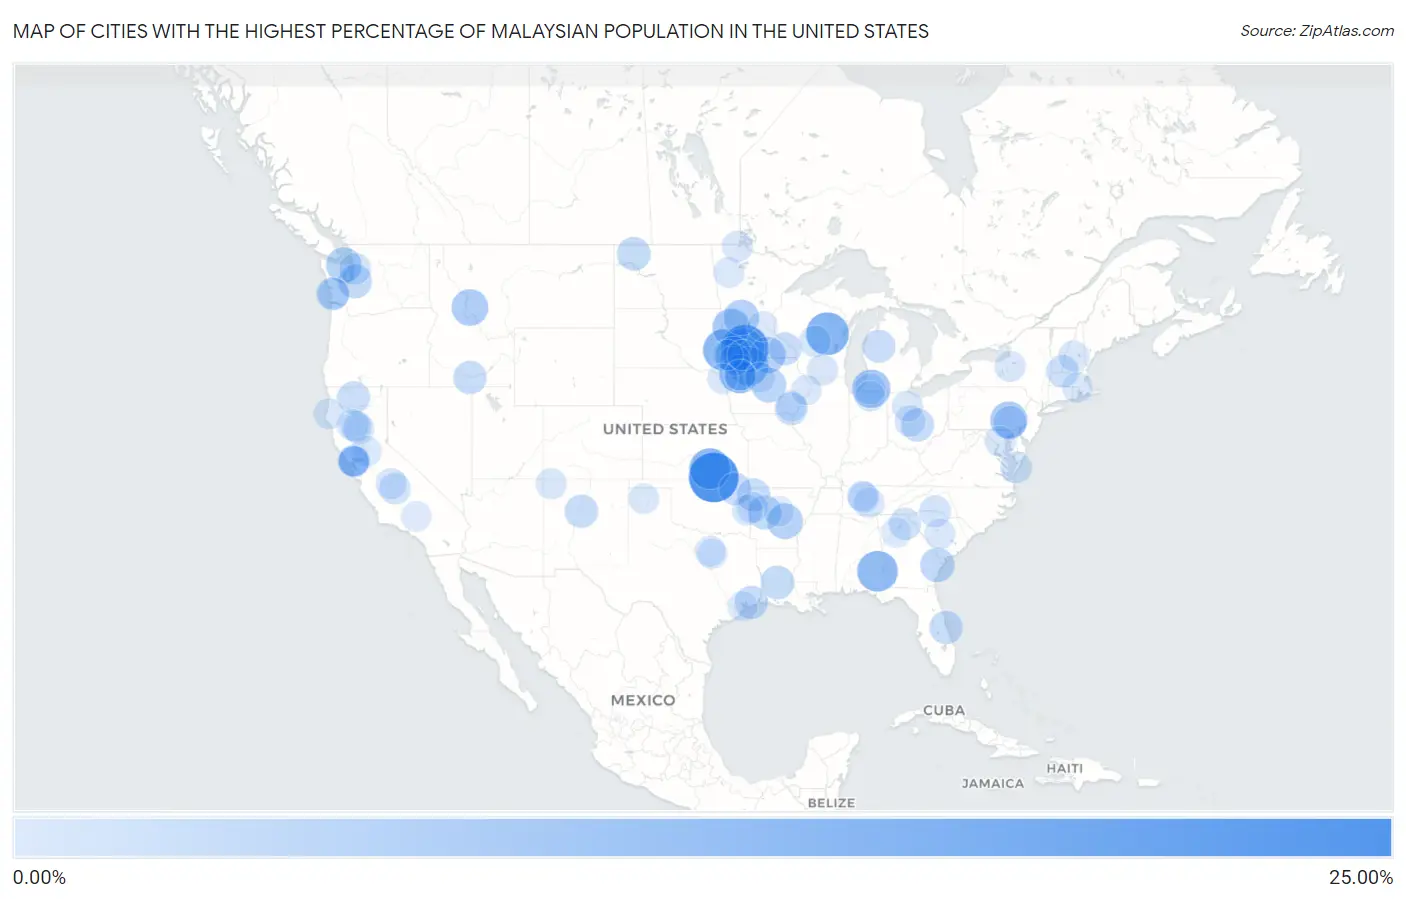
Cities with the Highest Percentage of Malaysian Population in the United States
| City | Malaysian | vs State | vs National | |
| 1. | Parkerfield | 23.05% | 0.19%(+22.9)#1 | 0.076%(+23.0)#1 |
| 2. | Butterfield | 20.49% | 0.23%(+20.3)#1 | 0.076%(+20.4)#2 |
| 3. | Tigerton | 15.46% | 0.10%(+15.4)#1 | 0.076%(+15.4)#3 |
| 4. | Camp Croft | 14.47% | 0.048%(+14.4)#1 | 0.076%(+14.4)#4 |
| 5. | Ihlen | 14.08% | 0.23%(+13.9)#2 | 0.076%(+14.0)#5 |
| 6. | Mountain Lake | 13.79% | 0.23%(+13.6)#3 | 0.076%(+13.7)#6 |
| 7. | Oaklawn Sunview | 13.71% | 0.19%(+13.5)#2 | 0.076%(+13.6)#7 |
| 8. | Blue Springs | 13.21% | 0.025%(+13.2)#1 | 0.076%(+13.1)#8 |
| 9. | Cylinder | 11.49% | 0.23%(+11.3)#1 | 0.076%(+11.4)#9 |
| 10. | Alta | 10.78% | 0.23%(+10.6)#2 | 0.076%(+10.7)#10 |
| 11. | Vandalia | 10.54% | 0.045%(+10.5)#1 | 0.076%(+10.5)#11 |
| 12. | Watson | 9.95% | 0.23%(+9.72)#4 | 0.076%(+9.87)#12 |
| 13. | Brickerville | 9.24% | 0.031%(+9.21)#1 | 0.076%(+9.16)#13 |
| 14. | Worthington | 9.10% | 0.23%(+8.87)#5 | 0.076%(+9.02)#14 |
| 15. | Darby | 8.85% | 0.018%(+8.83)#1 | 0.076%(+8.78)#15 |
| 16. | Hayward | 8.33% | 0.23%(+8.10)#6 | 0.076%(+8.26)#16 |
| 17. | Keo | 7.91% | 0.22%(+7.69)#1 | 0.076%(+7.84)#17 |
| 18. | Brooten | 7.79% | 0.23%(+7.56)#7 | 0.076%(+7.71)#18 |
| 19. | Bell Hill | 7.44% | 0.15%(+7.29)#1 | 0.076%(+7.37)#19 |
| 20. | Clemons | 7.19% | 0.23%(+6.96)#3 | 0.076%(+7.11)#20 |
| 21. | Henderson | 6.52% | 0.060%(+6.46)#1 | 0.076%(+6.45)#21 |
| 22. | Great Falls Crossing | 6.43% | 0.055%(+6.37)#1 | 0.076%(+6.35)#22 |
| 23. | Belleville | 6.10% | 0.22%(+5.88)#2 | 0.076%(+6.02)#23 |
| 24. | Algona | 5.88% | 0.15%(+5.73)#2 | 0.076%(+5.81)#24 |
| 25. | Glenmora | 5.59% | 0.067%(+5.52)#1 | 0.076%(+5.52)#25 |
| 26. | Powers Lake | 5.56% | 0.010%(+5.55)#1 | 0.076%(+5.48)#26 |
| 27. | Sandia Park | 5.35% | 0.019%(+5.33)#1 | 0.076%(+5.28)#27 |
| 28. | Brownstown | 5.33% | 0.031%(+5.30)#2 | 0.076%(+5.26)#28 |
| 29. | Stowell | 5.26% | 0.064%(+5.19)#1 | 0.076%(+5.18)#29 |
| 30. | Etna | 5.22% | 0.040%(+5.18)#1 | 0.076%(+5.14)#30 |
| 31. | Johnson | 5.21% | 0.22%(+4.99)#3 | 0.076%(+5.14)#31 |
| 32. | Enon Valley Borough | 5.21% | 0.031%(+5.18)#3 | 0.076%(+5.14)#32 |
| 33. | Palm Shores | 5.20% | 0.043%(+5.16)#1 | 0.076%(+5.12)#33 |
| 34. | Murtaugh | 5.19% | 0.088%(+5.11)#1 | 0.076%(+5.12)#34 |
| 35. | St Charles | 5.03% | 0.23%(+4.80)#8 | 0.076%(+4.95)#35 |
| 36. | South Bend | 5.00% | 0.15%(+4.85)#3 | 0.076%(+4.93)#36 |
| 37. | Tara Hills | 4.86% | 0.17%(+4.70)#1 | 0.076%(+4.79)#37 |
| 38. | Tustin | 4.85% | 0.045%(+4.81)#2 | 0.076%(+4.78)#38 |
| 39. | Salem | 4.73% | 0.23%(+4.50)#4 | 0.076%(+4.66)#39 |
| 40. | Weed | 4.64% | 0.17%(+4.47)#2 | 0.076%(+4.56)#40 |
| 41. | Bushyhead | 4.57% | 0.058%(+4.51)#1 | 0.076%(+4.49)#41 |
| 42. | Hutchison | 4.56% | 0.055%(+4.51)#2 | 0.076%(+4.49)#42 |
| 43. | Hinsdale | 4.33% | 0.080%(+4.25)#1 | 0.076%(+4.25)#43 |
| 44. | Alto | 3.99% | 0.060%(+3.93)#2 | 0.076%(+3.92)#44 |
| 45. | Nemaha | 3.96% | 0.23%(+3.73)#5 | 0.076%(+3.88)#45 |
| 46. | Millerton | 3.86% | 0.17%(+3.69)#3 | 0.076%(+3.78)#46 |
| 47. | Larch Way | 3.82% | 0.15%(+3.66)#4 | 0.076%(+3.74)#47 |
| 48. | Bobtown | 3.74% | 0.055%(+3.68)#3 | 0.076%(+3.66)#48 |
| 49. | Storm Lake | 3.68% | 0.23%(+3.45)#6 | 0.076%(+3.60)#49 |
| 50. | Grover | 3.68% | 0.066%(+3.61)#1 | 0.076%(+3.60)#50 |
| 51. | Raymond | 3.62% | 0.15%(+3.47)#5 | 0.076%(+3.55)#51 |
| 52. | London | 3.47% | 0.17%(+3.31)#4 | 0.076%(+3.40)#52 |
| 53. | Nekoosa | 3.42% | 0.10%(+3.31)#2 | 0.076%(+3.34)#53 |
| 54. | Rancho Tehama Reserve | 3.40% | 0.17%(+3.24)#5 | 0.076%(+3.33)#54 |
| 55. | Ocheyedan | 3.29% | 0.23%(+3.06)#7 | 0.076%(+3.22)#55 |
| 56. | Sunnyside | 3.09% | 0.17%(+2.92)#6 | 0.076%(+3.01)#56 |
| 57. | Hamilton City | 3.06% | 0.17%(+2.89)#7 | 0.076%(+2.98)#57 |
| 58. | Bristol | 3.05% | 0.080%(+2.97)#2 | 0.076%(+2.98)#58 |
| 59. | Daniels Farm | 3.05% | 0.10%(+2.94)#1 | 0.076%(+2.97)#59 |
| 60. | Smyrna | 3.03% | 0.14%(+2.90)#1 | 0.076%(+2.96)#60 |
| 61. | Clintonville Borough | 3.01% | 0.031%(+2.98)#4 | 0.076%(+2.94)#61 |
| 62. | Cassopolis | 2.97% | 0.045%(+2.93)#3 | 0.076%(+2.90)#62 |
| 63. | San Pablo | 2.96% | 0.17%(+2.79)#8 | 0.076%(+2.88)#63 |
| 64. | Waterflow | 2.94% | 0.019%(+2.92)#2 | 0.076%(+2.87)#64 |
| 65. | Warroad | 2.94% | 0.23%(+2.71)#9 | 0.076%(+2.86)#65 |
| 66. | New California | 2.93% | 0.040%(+2.89)#2 | 0.076%(+2.86)#66 |
| 67. | Fort Smith | 2.91% | 0.22%(+2.69)#4 | 0.076%(+2.83)#67 |
| 68. | Lakeland | 2.87% | 0.024%(+2.84)#1 | 0.076%(+2.79)#68 |
| 69. | Spiro | 2.86% | 0.058%(+2.81)#2 | 0.076%(+2.79)#69 |
| 70. | Lakeside | 2.85% | 0.23%(+2.62)#8 | 0.076%(+2.78)#70 |
| 71. | Corning | 2.81% | 0.17%(+2.64)#9 | 0.076%(+2.73)#71 |
| 72. | West Laurel | 2.79% | 0.022%(+2.77)#1 | 0.076%(+2.72)#72 |
| 73. | Brooklyn | 2.76% | 0.10%(+2.66)#3 | 0.076%(+2.69)#73 |
| 74. | Carey | 2.76% | 0.040%(+2.72)#3 | 0.076%(+2.68)#74 |
| 75. | Lakewood Park | 2.71% | 0.14%(+2.57)#2 | 0.076%(+2.63)#75 |
| 76. | Lemon Hill | 2.68% | 0.17%(+2.51)#10 | 0.076%(+2.60)#76 |
| 77. | Hydesville | 2.64% | 0.17%(+2.47)#11 | 0.076%(+2.57)#77 |
| 78. | Mount Pleasant | 2.64% | 0.23%(+2.41)#9 | 0.076%(+2.56)#78 |
| 79. | Woonsocket | 2.57% | 0.28%(+2.29)#1 | 0.076%(+2.50)#79 |
| 80. | Dumas | 2.57% | 0.064%(+2.50)#2 | 0.076%(+2.49)#80 |
| 81. | Magnolia | 2.53% | 0.23%(+2.30)#10 | 0.076%(+2.45)#81 |
| 82. | La Vergne | 2.52% | 0.14%(+2.38)#3 | 0.076%(+2.44)#82 |
| 83. | North Richmond | 2.52% | 0.17%(+2.35)#12 | 0.076%(+2.44)#83 |
| 84. | Erskine | 2.50% | 0.23%(+2.27)#11 | 0.076%(+2.42)#84 |
| 85. | Haltom City | 2.48% | 0.064%(+2.42)#3 | 0.076%(+2.41)#85 |
| 86. | Waimea Cdp Hawaii County | 2.47% | 0.18%(+2.28)#1 | 0.076%(+2.39)#86 |
| 87. | Pine Ridge | 2.46% | 0.048%(+2.41)#2 | 0.076%(+2.38)#87 |
| 88. | Dakota City | 2.45% | 0.075%(+2.37)#1 | 0.076%(+2.37)#88 |
| 89. | Dewitt | 2.43% | 0.23%(+2.20)#10 | 0.076%(+2.36)#89 |
| 90. | Jackson | 2.39% | 0.23%(+2.16)#12 | 0.076%(+2.32)#90 |
| 91. | Dalworthington Gardens | 2.38% | 0.064%(+2.32)#4 | 0.076%(+2.30)#91 |
| 92. | Norcross | 2.37% | 0.060%(+2.31)#3 | 0.076%(+2.30)#92 |
| 93. | Union Mill | 2.35% | 0.055%(+2.29)#4 | 0.076%(+2.27)#93 |
| 94. | Edwards Afb | 2.34% | 0.17%(+2.17)#13 | 0.076%(+2.26)#94 |
| 95. | Wooster | 2.34% | 0.22%(+2.12)#5 | 0.076%(+2.26)#95 |
| 96. | Rollingwood | 2.30% | 0.17%(+2.13)#14 | 0.076%(+2.22)#96 |
| 97. | Seabrook | 2.27% | 0.064%(+2.21)#5 | 0.076%(+2.20)#97 |
| 98. | Wakarusa | 2.25% | 0.030%(+2.22)#1 | 0.076%(+2.18)#98 |
| 99. | Corcoran | 2.24% | 0.23%(+2.02)#13 | 0.076%(+2.17)#99 |
| 100. | Webster City | 2.23% | 0.23%(+2.00)#11 | 0.076%(+2.16)#100 |
Common Questions
What are the Top 10 Cities with the Highest Percentage of Malaysian Population in the United States?
Top 10 Cities with the Highest Percentage of Malaysian Population in the United States are:
#1
23.05%
#2
20.49%
#3
15.46%
#4
14.08%
#5
13.79%
#6
13.71%
#7
13.21%
#8
11.49%
#9
10.78%
#10
10.54%
What city has the Highest Percentage of Malaysian Population in the United States?
Parkerfield has the Highest Percentage of Malaysian Population in the United States with 23.05%.
What is the Percentage of Malaysian Population in the United States?
Percentage of Malaysian Population in the United States is 0.076%.