Cities with the Highest Percentage of Malaysian Population in Illinois
RELATED REPORTS & OPTIONS
Malaysian
Illinois
Compare Cities
Map of Cities with the Highest Percentage of Malaysian Population in Illinois
0.00%
2.50%
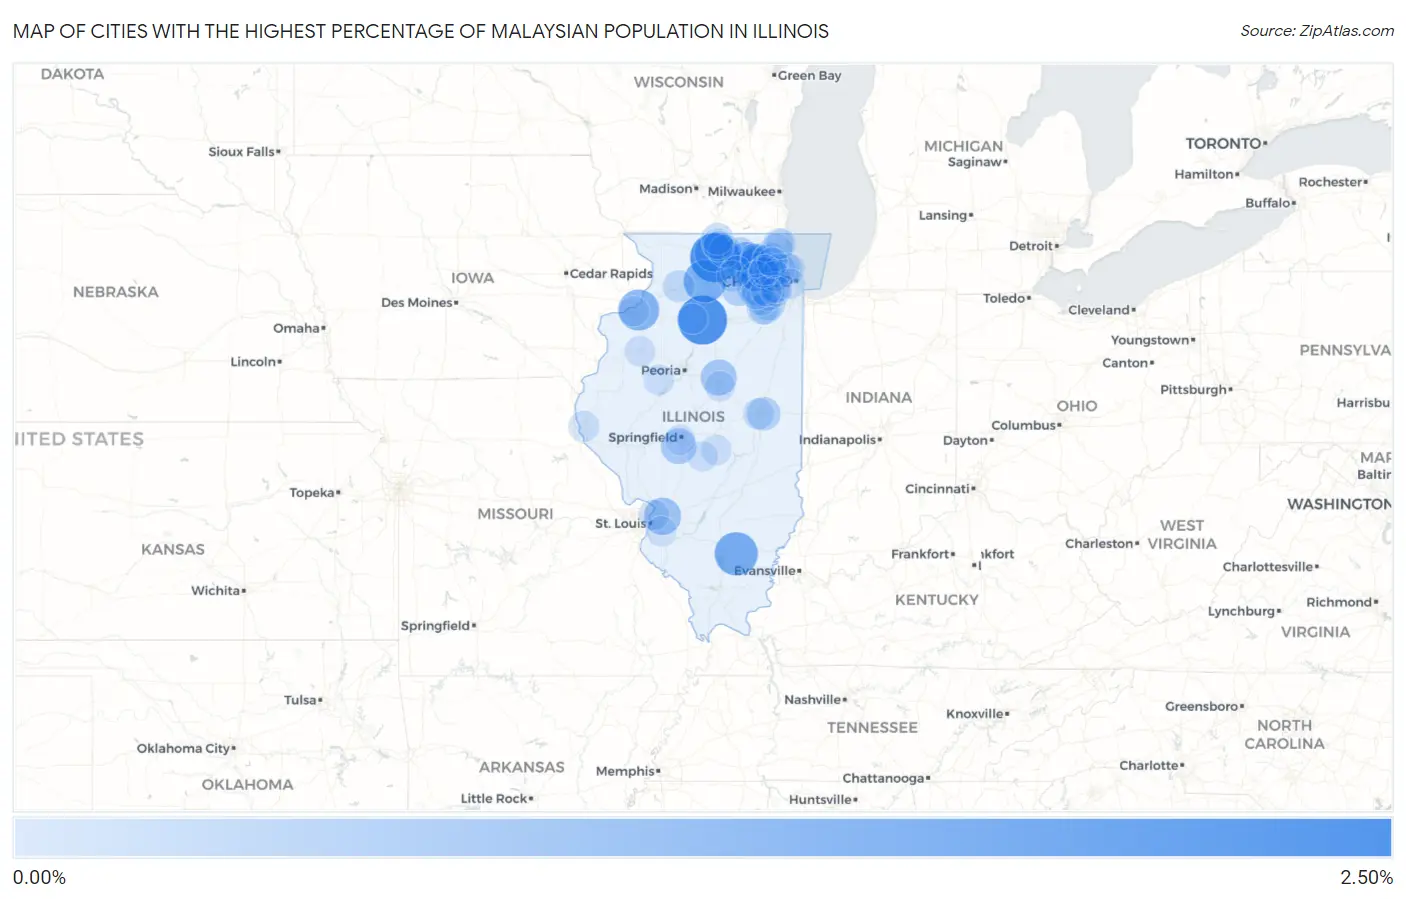
Cities with the Highest Percentage of Malaysian Population in Illinois
| City | Malaysian | vs State | vs National | |
| 1. | New Milford | 2.12% | 0.055%(+2.07)#1 | 0.076%(+2.05)#107 |
| 2. | Seatonville | 2.08% | 0.055%(+2.03)#2 | 0.076%(+2.01)#112 |
| 3. | Dahlgren | 1.40% | 0.055%(+1.35)#3 | 0.076%(+1.33)#180 |
| 4. | Ashton | 1.36% | 0.055%(+1.31)#4 | 0.076%(+1.29)#182 |
| 5. | Elgin | 1.16% | 0.055%(+1.11)#5 | 0.076%(+1.09)#223 |
| 6. | Silvis | 1.16% | 0.055%(+1.10)#6 | 0.076%(+1.08)#226 |
| 7. | Hampshire | 1.15% | 0.055%(+1.09)#7 | 0.076%(+1.07)#231 |
| 8. | South Elgin | 1.12% | 0.055%(+1.06)#8 | 0.076%(+1.04)#241 |
| 9. | Rockford | 0.89% | 0.055%(+0.833)#9 | 0.076%(+0.812)#285 |
| 10. | Gilberts | 0.77% | 0.055%(+0.715)#10 | 0.076%(+0.694)#321 |
| 11. | Maryville | 0.75% | 0.055%(+0.700)#11 | 0.076%(+0.679)#326 |
| 12. | North Aurora | 0.64% | 0.055%(+0.587)#12 | 0.076%(+0.566)#370 |
| 13. | Hudson | 0.63% | 0.055%(+0.574)#13 | 0.076%(+0.553)#377 |
| 14. | Chatham | 0.57% | 0.055%(+0.520)#14 | 0.076%(+0.499)#409 |
| 15. | Hanover Park | 0.50% | 0.055%(+0.448)#15 | 0.076%(+0.427)#463 |
| 16. | Hinckley | 0.42% | 0.055%(+0.363)#16 | 0.076%(+0.342)#530 |
| 17. | Roselle | 0.37% | 0.055%(+0.313)#17 | 0.076%(+0.292)#572 |
| 18. | Urbana | 0.36% | 0.055%(+0.309)#18 | 0.076%(+0.288)#577 |
| 19. | Crest Hill | 0.33% | 0.055%(+0.277)#19 | 0.076%(+0.256)#609 |
| 20. | Marengo | 0.32% | 0.055%(+0.266)#20 | 0.076%(+0.245)#619 |
| 21. | Carpentersville | 0.31% | 0.055%(+0.252)#21 | 0.076%(+0.231)#642 |
| 22. | Belvidere | 0.29% | 0.055%(+0.237)#22 | 0.076%(+0.216)#667 |
| 23. | Deer Park | 0.24% | 0.055%(+0.189)#23 | 0.076%(+0.168)#753 |
| 24. | Libertyville | 0.24% | 0.055%(+0.184)#24 | 0.076%(+0.163)#762 |
| 25. | Glendale Heights | 0.22% | 0.055%(+0.169)#25 | 0.076%(+0.148)#795 |
| 26. | Aurora | 0.20% | 0.055%(+0.140)#26 | 0.076%(+0.119)#865 |
| 27. | Sterling | 0.18% | 0.055%(+0.127)#27 | 0.076%(+0.106)#903 |
| 28. | Roscoe | 0.18% | 0.055%(+0.125)#28 | 0.076%(+0.104)#911 |
| 29. | Shorewood | 0.16% | 0.055%(+0.105)#29 | 0.076%(+0.084)#963 |
| 30. | Joliet | 0.15% | 0.055%(+0.097)#30 | 0.076%(+0.076)#993 |
| 31. | Cahokia Heights | 0.14% | 0.055%(+0.080)#31 | 0.076%(+0.059)#1,038 |
| 32. | Algonquin | 0.13% | 0.055%(+0.076)#32 | 0.076%(+0.055)#1,052 |
| 33. | Morton Grove | 0.12% | 0.055%(+0.070)#33 | 0.076%(+0.049)#1,075 |
| 34. | Champaign | 0.12% | 0.055%(+0.067)#34 | 0.076%(+0.046)#1,085 |
| 35. | Dekalb | 0.12% | 0.055%(+0.066)#35 | 0.076%(+0.045)#1,088 |
| 36. | Bolingbrook | 0.11% | 0.055%(+0.059)#36 | 0.076%(+0.038)#1,108 |
| 37. | Plainfield | 0.11% | 0.055%(+0.054)#37 | 0.076%(+0.033)#1,133 |
| 38. | Boulder Hill | 0.094% | 0.055%(+0.039)#38 | 0.076%(+0.018)#1,186 |
| 39. | Quincy | 0.094% | 0.055%(+0.039)#39 | 0.076%(+0.018)#1,188 |
| 40. | Park Ridge | 0.091% | 0.055%(+0.037)#40 | 0.076%(+0.016)#1,199 |
| 41. | Downers Grove | 0.090% | 0.055%(+0.035)#41 | 0.076%(+0.014)#1,207 |
| 42. | Barrington | 0.080% | 0.055%(+0.025)#42 | 0.076%(+0.004)#1,257 |
| 43. | Westmont | 0.078% | 0.055%(+0.024)#43 | 0.076%(+0.002)#1,267 |
| 44. | Schaumburg | 0.075% | 0.055%(+0.020)#44 | 0.076%(-0.001)#1,287 |
| 45. | Machesney Park | 0.074% | 0.055%(+0.020)#45 | 0.076%(-0.001)#1,290 |
| 46. | Sycamore | 0.061% | 0.055%(+0.006)#46 | 0.076%(-0.015)#1,347 |
| 47. | Galesburg | 0.060% | 0.055%(+0.005)#47 | 0.076%(-0.016)#1,349 |
| 48. | Canton | 0.060% | 0.055%(+0.005)#48 | 0.076%(-0.016)#1,353 |
| 49. | St Charles | 0.058% | 0.055%(+0.003)#49 | 0.076%(-0.018)#1,366 |
| 50. | Gurnee | 0.052% | 0.055%(-0.003)#50 | 0.076%(-0.024)#1,390 |
| 51. | Moweaqua | 0.051% | 0.055%(-0.003)#51 | 0.076%(-0.024)#1,394 |
| 52. | Skokie | 0.046% | 0.055%(-0.009)#52 | 0.076%(-0.030)#1,427 |
| 53. | Granite City | 0.044% | 0.055%(-0.010)#53 | 0.076%(-0.031)#1,441 |
| 54. | Des Plaines | 0.040% | 0.055%(-0.015)#54 | 0.076%(-0.036)#1,481 |
| 55. | Addison | 0.036% | 0.055%(-0.018)#55 | 0.076%(-0.039)#1,512 |
| 56. | Taylorville | 0.035% | 0.055%(-0.019)#56 | 0.076%(-0.040)#1,517 |
| 57. | Bartlett | 0.034% | 0.055%(-0.020)#57 | 0.076%(-0.042)#1,523 |
| 58. | Bloomington | 0.033% | 0.055%(-0.022)#58 | 0.076%(-0.043)#1,532 |
| 59. | Springfield | 0.032% | 0.055%(-0.022)#59 | 0.076%(-0.043)#1,535 |
| 60. | Darien | 0.032% | 0.055%(-0.023)#60 | 0.076%(-0.044)#1,540 |
| 61. | Streamwood | 0.030% | 0.055%(-0.024)#61 | 0.076%(-0.045)#1,556 |
| 62. | Chicago | 0.027% | 0.055%(-0.028)#62 | 0.076%(-0.049)#1,577 |
| 63. | Moline | 0.021% | 0.055%(-0.034)#63 | 0.076%(-0.055)#1,624 |
| 64. | Loves Park | 0.013% | 0.055%(-0.042)#64 | 0.076%(-0.063)#1,704 |
| 65. | Park City | 0.013% | 0.055%(-0.042)#65 | 0.076%(-0.063)#1,706 |
| 66. | Princeton | 0.013% | 0.055%(-0.042)#66 | 0.076%(-0.063)#1,707 |
| 67. | Belleville | 0.012% | 0.055%(-0.043)#67 | 0.076%(-0.064)#1,716 |
| 68. | Naperville | 0.0094% | 0.055%(-0.045)#68 | 0.076%(-0.066)#1,740 |
| 69. | Palatine | 0.0074% | 0.055%(-0.047)#69 | 0.076%(-0.068)#1,755 |
Common Questions
What are the Top 10 Cities with the Highest Percentage of Malaysian Population in Illinois?
Top 10 Cities with the Highest Percentage of Malaysian Population in Illinois are:
#1
2.12%
#2
2.08%
#3
1.40%
#4
1.36%
#5
1.16%
#6
1.16%
#7
1.15%
#8
1.12%
#9
0.89%
#10
0.77%
What city has the Highest Percentage of Malaysian Population in Illinois?
New Milford has the Highest Percentage of Malaysian Population in Illinois with 2.12%.
What is the Percentage of Malaysian Population in the State of Illinois?
Percentage of Malaysian Population in Illinois is 0.055%.
What is the Percentage of Malaysian Population in the United States?
Percentage of Malaysian Population in the United States is 0.076%.