Cities with the Highest Percentage of Lithuanian Population in Connecticut
RELATED REPORTS & OPTIONS
Lithuanian
Connecticut
Compare Cities
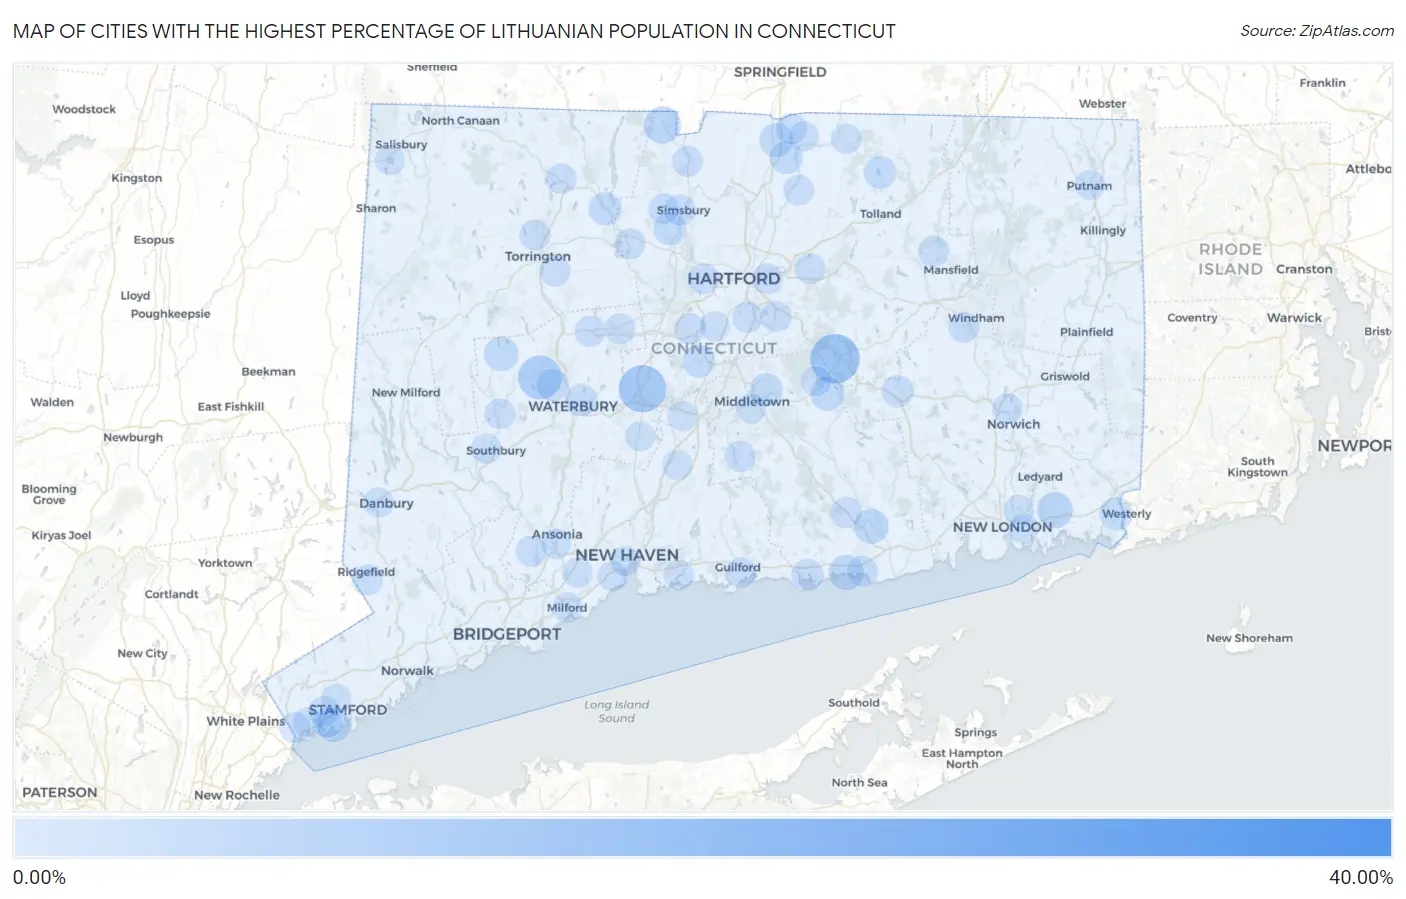
Map of Cities with the Highest Percentage of Lithuanian Population in Connecticut
0.00%
40.00%
Cities with the Highest Percentage of Lithuanian Population in Connecticut
| City | Lithuanian | vs State | vs National | |
| 1. | Candlewood Isle | 30.84% | 0.71%(+30.1)#1 | 0.19%(+30.6)#5 |
| 2. | Terramuggus | 9.90% | 0.71%(+9.19)#2 | 0.19%(+9.71)#41 |
| 3. | Mechanicsville | 9.04% | 0.71%(+8.33)#3 | 0.19%(+8.86)#52 |
| 4. | Plantsville | 8.78% | 0.71%(+8.07)#4 | 0.19%(+8.60)#55 |
| 5. | Watertown | 7.12% | 0.71%(+6.41)#5 | 0.19%(+6.93)#75 |
| 6. | Dodgingtown | 6.74% | 0.71%(+6.03)#6 | 0.19%(+6.56)#85 |
| 7. | North Granby | 3.79% | 0.71%(+3.08)#7 | 0.19%(+3.61)#198 |
| 8. | Indian Field | 3.33% | 0.71%(+2.62)#8 | 0.19%(+3.14)#234 |
| 9. | Old Mystic | 3.13% | 0.71%(+2.42)#9 | 0.19%(+2.95)#256 |
| 10. | Westbrook Center | 2.81% | 0.71%(+2.10)#10 | 0.19%(+2.62)#285 |
| 11. | Darien Downtown | 2.80% | 0.71%(+2.10)#11 | 0.19%(+2.62)#286 |
| 12. | Essex Village | 2.57% | 0.71%(+1.86)#12 | 0.19%(+2.38)#326 |
| 13. | Bethlehem Village | 2.52% | 0.71%(+1.81)#13 | 0.19%(+2.34)#333 |
| 14. | Mamanasco Lake | 2.34% | 0.71%(+1.63)#14 | 0.19%(+2.16)#365 |
| 15. | East Hampton | 2.31% | 0.71%(+1.60)#15 | 0.19%(+2.12)#373 |
| 16. | Lordship | 2.29% | 0.71%(+1.58)#16 | 0.19%(+2.10)#378 |
| 17. | Old Greenwich | 2.24% | 0.71%(+1.53)#17 | 0.19%(+2.05)#389 |
| 18. | Thompsonville | 2.16% | 0.71%(+1.45)#18 | 0.19%(+1.98)#415 |
| 19. | Pawcatuck | 1.94% | 0.71%(+1.23)#19 | 0.19%(+1.75)#484 |
| 20. | Stepney | 1.91% | 0.71%(+1.20)#20 | 0.19%(+1.72)#501 |
| 21. | Portland | 1.87% | 0.71%(+1.16)#21 | 0.19%(+1.68)#515 |
| 22. | Weatogue | 1.76% | 0.71%(+1.05)#22 | 0.19%(+1.57)#558 |
| 23. | New Hartford Center | 1.76% | 0.71%(+1.05)#23 | 0.19%(+1.57)#559 |
| 24. | Southwood Acres | 1.73% | 0.71%(+1.02)#24 | 0.19%(+1.54)#580 |
| 25. | Kensington | 1.67% | 0.71%(+0.962)#25 | 0.19%(+1.48)#610 |
| 26. | Crystal Lake | 1.54% | 0.71%(+0.830)#26 | 0.19%(+1.35)#685 |
| 27. | Waterbury | 1.45% | 0.71%(+0.739)#27 | 0.19%(+1.26)#738 |
| 28. | Oakville | 1.43% | 0.71%(+0.719)#28 | 0.19%(+1.24)#747 |
| 29. | Naugatuck Borough | 1.40% | 0.71%(+0.691)#29 | 0.19%(+1.21)#767 |
| 30. | Staples | 1.39% | 0.71%(+0.680)#30 | 0.19%(+1.20)#774 |
| 31. | Colchester | 1.36% | 0.71%(+0.647)#31 | 0.19%(+1.17)#801 |
| 32. | Clinton | 1.25% | 0.71%(+0.544)#32 | 0.19%(+1.07)#866 |
| 33. | Northford | 1.21% | 0.71%(+0.503)#33 | 0.19%(+1.03)#906 |
| 34. | Compo | 1.04% | 0.71%(+0.336)#34 | 0.19%(+0.859)#1,091 |
| 35. | Deep River Center | 0.96% | 0.71%(+0.254)#35 | 0.19%(+0.778)#1,214 |
| 36. | Inglenook | 0.92% | 0.71%(+0.216)#36 | 0.19%(+0.739)#1,289 |
| 37. | Pemberwick | 0.90% | 0.71%(+0.194)#37 | 0.19%(+0.718)#1,324 |
| 38. | Storrs | 0.90% | 0.71%(+0.189)#38 | 0.19%(+0.712)#1,340 |
| 39. | Simsbury Center | 0.87% | 0.71%(+0.159)#39 | 0.19%(+0.682)#1,386 |
| 40. | Torrington | 0.85% | 0.71%(+0.142)#40 | 0.19%(+0.665)#1,430 |
| 41. | Sherwood Manor | 0.82% | 0.71%(+0.112)#41 | 0.19%(+0.635)#1,491 |
| 42. | New Britain | 0.82% | 0.71%(+0.108)#42 | 0.19%(+0.631)#1,503 |
| 43. | Bristol | 0.80% | 0.71%(+0.094)#43 | 0.19%(+0.617)#1,528 |
| 44. | Durham | 0.78% | 0.71%(+0.070)#44 | 0.19%(+0.593)#1,583 |
| 45. | Glastonbury Center | 0.77% | 0.71%(+0.058)#45 | 0.19%(+0.581)#1,605 |
| 46. | Shelton | 0.75% | 0.71%(+0.037)#46 | 0.19%(+0.560)#1,643 |
| 47. | Terryville | 0.74% | 0.71%(+0.032)#47 | 0.19%(+0.555)#1,653 |
| 48. | Saybrook Manor | 0.73% | 0.71%(+0.023)#48 | 0.19%(+0.546)#1,669 |
| 49. | West Hartford | 0.73% | 0.71%(+0.022)#49 | 0.19%(+0.545)#1,672 |
| 50. | Fairfield University | 0.69% | 0.71%(-0.014)#50 | 0.19%(+0.509)#1,759 |
| 51. | East Hartford | 0.66% | 0.71%(-0.049)#51 | 0.19%(+0.474)#1,845 |
| 52. | Salmon Brook | 0.64% | 0.71%(-0.067)#52 | 0.19%(+0.456)#1,897 |
| 53. | Collinsville | 0.64% | 0.71%(-0.069)#53 | 0.19%(+0.455)#1,903 |
| 54. | Manchester | 0.62% | 0.71%(-0.087)#54 | 0.19%(+0.436)#1,959 |
| 55. | Coleytown | 0.62% | 0.71%(-0.089)#55 | 0.19%(+0.434)#1,966 |
| 56. | Wethersfield | 0.61% | 0.71%(-0.094)#56 | 0.19%(+0.429)#1,985 |
| 57. | East | 0.60% | 0.71%(-0.112)#57 | 0.19%(+0.412)#2,045 |
| 58. | Northwest Harwinton | 0.59% | 0.71%(-0.115)#58 | 0.19%(+0.408)#2,054 |
| 59. | Guilford Center | 0.59% | 0.71%(-0.118)#59 | 0.19%(+0.405)#2,068 |
| 60. | Ridgefield | 0.59% | 0.71%(-0.121)#60 | 0.19%(+0.403)#2,082 |
| 61. | Groton Long Point Borough | 0.58% | 0.71%(-0.128)#61 | 0.19%(+0.395)#2,110 |
| 62. | Bantam Borough | 0.57% | 0.71%(-0.135)#62 | 0.19%(+0.389)#2,129 |
| 63. | West Simsbury | 0.57% | 0.71%(-0.136)#63 | 0.19%(+0.387)#2,139 |
| 64. | Norwich | 0.57% | 0.71%(-0.139)#64 | 0.19%(+0.384)#2,148 |
| 65. | South Windham | 0.57% | 0.71%(-0.142)#65 | 0.19%(+0.381)#2,163 |
| 66. | Cos Cob | 0.57% | 0.71%(-0.142)#66 | 0.19%(+0.381)#2,165 |
| 67. | Westport | 0.56% | 0.71%(-0.146)#67 | 0.19%(+0.377)#2,178 |
| 68. | Old Hill | 0.56% | 0.71%(-0.148)#68 | 0.19%(+0.375)#2,188 |
| 69. | Woodbury Center | 0.55% | 0.71%(-0.155)#69 | 0.19%(+0.368)#2,224 |
| 70. | Winsted | 0.55% | 0.71%(-0.156)#70 | 0.19%(+0.367)#2,230 |
| 71. | Broad Brook | 0.55% | 0.71%(-0.159)#71 | 0.19%(+0.364)#2,243 |
| 72. | Newtown Borough | 0.51% | 0.71%(-0.198)#72 | 0.19%(+0.325)#2,396 |
| 73. | Wallingford Center | 0.51% | 0.71%(-0.202)#73 | 0.19%(+0.322)#2,413 |
| 74. | Noroton Heights | 0.50% | 0.71%(-0.210)#74 | 0.19%(+0.314)#2,443 |
| 75. | Somers | 0.49% | 0.71%(-0.215)#75 | 0.19%(+0.308)#2,467 |
| 76. | Branford Center | 0.47% | 0.71%(-0.241)#76 | 0.19%(+0.282)#2,568 |
| 77. | Heritage Village | 0.45% | 0.71%(-0.255)#77 | 0.19%(+0.268)#2,622 |
| 78. | Derby | 0.44% | 0.71%(-0.264)#78 | 0.19%(+0.259)#2,666 |
| 79. | West Haven | 0.44% | 0.71%(-0.271)#79 | 0.19%(+0.252)#2,700 |
| 80. | Woodmont Borough | 0.43% | 0.71%(-0.276)#80 | 0.19%(+0.247)#2,724 |
| 81. | Noroton | 0.43% | 0.71%(-0.280)#81 | 0.19%(+0.243)#2,748 |
| 82. | Hazardville | 0.42% | 0.71%(-0.284)#82 | 0.19%(+0.239)#2,768 |
| 83. | Lake Pocotopaug | 0.42% | 0.71%(-0.288)#83 | 0.19%(+0.235)#2,791 |
| 84. | Milford City Balance | 0.40% | 0.71%(-0.312)#84 | 0.19%(+0.212)#2,923 |
| 85. | Putnam | 0.39% | 0.71%(-0.320)#85 | 0.19%(+0.203)#2,980 |
| 86. | Orange | 0.39% | 0.71%(-0.322)#86 | 0.19%(+0.201)#2,994 |
| 87. | Danbury | 0.37% | 0.71%(-0.337)#87 | 0.19%(+0.186)#3,079 |
| 88. | Meriden | 0.36% | 0.71%(-0.353)#88 | 0.19%(+0.170)#3,167 |
| 89. | Stamford | 0.35% | 0.71%(-0.356)#89 | 0.19%(+0.168)#3,188 |
| 90. | Conning Towers Nautilus Park | 0.35% | 0.71%(-0.360)#90 | 0.19%(+0.163)#3,220 |
| 91. | Cheshire Village | 0.34% | 0.71%(-0.368)#91 | 0.19%(+0.155)#3,274 |
| 92. | Lakeville | 0.34% | 0.71%(-0.370)#92 | 0.19%(+0.153)#3,282 |
| 93. | Newington | 0.33% | 0.71%(-0.377)#93 | 0.19%(+0.146)#3,321 |
| 94. | Mill Plain | 0.33% | 0.71%(-0.383)#94 | 0.19%(+0.141)#3,358 |
| 95. | Greenwich | 0.29% | 0.71%(-0.417)#95 | 0.19%(+0.107)#3,616 |
| 96. | New Haven | 0.29% | 0.71%(-0.418)#96 | 0.19%(+0.106)#3,627 |
| 97. | Long Hill | 0.29% | 0.71%(-0.421)#97 | 0.19%(+0.102)#3,658 |
| 98. | Middletown | 0.28% | 0.71%(-0.428)#98 | 0.19%(+0.095)#3,726 |
| 99. | Riverside | 0.27% | 0.71%(-0.434)#99 | 0.19%(+0.090)#3,769 |
| 100. | Tashua | 0.26% | 0.71%(-0.444)#100 | 0.19%(+0.079)#3,860 |
Common Questions
What are the Top 10 Cities with the Highest Percentage of Lithuanian Population in Connecticut?
Top 10 Cities with the Highest Percentage of Lithuanian Population in Connecticut are:
#1
9.90%
#2
8.78%
#3
7.12%
#4
3.79%
#5
3.13%
#6
2.81%
#7
2.57%
#8
2.52%
#9
2.31%
#10
2.24%
What city has the Highest Percentage of Lithuanian Population in Connecticut?
Terramuggus has the Highest Percentage of Lithuanian Population in Connecticut with 9.90%.
What is the Percentage of Lithuanian Population in the State of Connecticut?
Percentage of Lithuanian Population in Connecticut is 0.71%.
What is the Percentage of Lithuanian Population in the United States?
Percentage of Lithuanian Population in the United States is 0.19%.