Cities with the Highest Percentage of Lithuanian Population in Massachusetts
RELATED REPORTS & OPTIONS
Lithuanian
Massachusetts
Compare Cities
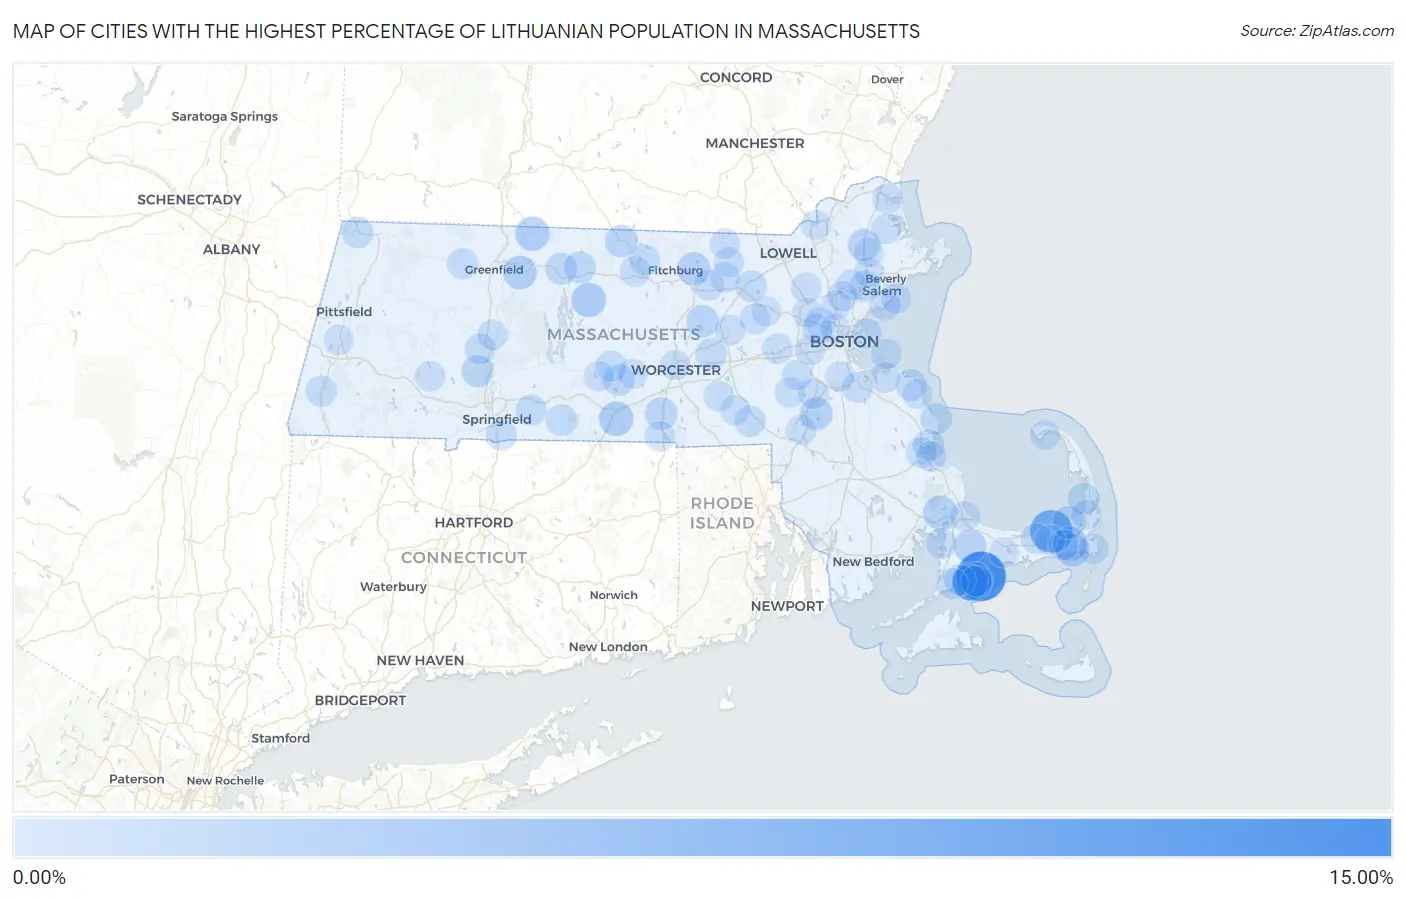
Map of Cities with the Highest Percentage of Lithuanian Population in Massachusetts
0.00%
15.00%
Cities with the Highest Percentage of Lithuanian Population in Massachusetts
| City | Lithuanian | vs State | vs National | |
| 1. | Popponesset Island | 14.29% | 0.60%(+13.7)#1 | 0.19%(+14.1)#29 |
| 2. | East Dennis | 9.27% | 0.60%(+8.67)#2 | 0.19%(+9.08)#49 |
| 3. | Monomoscoy Island | 7.32% | 0.60%(+6.72)#3 | 0.19%(+7.13)#68 |
| 4. | Seconsett Island | 4.38% | 0.60%(+3.78)#4 | 0.19%(+4.19)#154 |
| 5. | Harwich Center | 3.74% | 0.60%(+3.14)#5 | 0.19%(+3.55)#203 |
| 6. | Sturbridge | 3.65% | 0.60%(+3.05)#6 | 0.19%(+3.46)#209 |
| 7. | Petersham | 3.64% | 0.60%(+3.04)#7 | 0.19%(+3.45)#210 |
| 8. | Northfield | 3.41% | 0.60%(+2.82)#8 | 0.19%(+3.23)#227 |
| 9. | White Island Shores | 3.24% | 0.60%(+2.64)#9 | 0.19%(+3.05)#245 |
| 10. | Harwich Port | 2.93% | 0.60%(+2.33)#10 | 0.19%(+2.75)#270 |
| 11. | Millers Falls | 2.92% | 0.60%(+2.33)#11 | 0.19%(+2.74)#271 |
| 12. | Lunenburg | 2.79% | 0.60%(+2.20)#12 | 0.19%(+2.61)#288 |
| 13. | West Warren | 2.66% | 0.60%(+2.07)#13 | 0.19%(+2.48)#307 |
| 14. | Sharon | 2.62% | 0.60%(+2.03)#14 | 0.19%(+2.44)#311 |
| 15. | Forestdale | 2.56% | 0.60%(+1.96)#15 | 0.19%(+2.37)#328 |
| 16. | Brewster | 2.53% | 0.60%(+1.93)#16 | 0.19%(+2.35)#330 |
| 17. | Oxford | 2.27% | 0.60%(+1.68)#17 | 0.19%(+2.09)#380 |
| 18. | Clinton | 2.21% | 0.60%(+1.62)#18 | 0.19%(+2.03)#398 |
| 19. | Winchendon | 2.17% | 0.60%(+1.58)#19 | 0.19%(+1.99)#408 |
| 20. | Boxford | 2.10% | 0.60%(+1.50)#20 | 0.19%(+1.92)#428 |
| 21. | Easthampton Town | 1.93% | 0.60%(+1.33)#21 | 0.19%(+1.74)#491 |
| 22. | Athol | 1.86% | 0.60%(+1.26)#22 | 0.19%(+1.67)#517 |
| 23. | North Eastham | 1.83% | 0.60%(+1.23)#23 | 0.19%(+1.64)#531 |
| 24. | Orange | 1.80% | 0.60%(+1.20)#24 | 0.19%(+1.61)#546 |
| 25. | East Brookfield | 1.71% | 0.60%(+1.11)#25 | 0.19%(+1.52)#586 |
| 26. | Ocean Bluff Brant Rock | 1.68% | 0.60%(+1.09)#26 | 0.19%(+1.50)#606 |
| 27. | North Scituate | 1.64% | 0.60%(+1.04)#27 | 0.19%(+1.45)#629 |
| 28. | Williamstown | 1.60% | 0.60%(+1.00)#28 | 0.19%(+1.42)#644 |
| 29. | Littleton Common | 1.53% | 0.60%(+0.937)#29 | 0.19%(+1.35)#693 |
| 30. | Monson Center | 1.49% | 0.60%(+0.898)#30 | 0.19%(+1.31)#711 |
| 31. | Bellingham | 1.49% | 0.60%(+0.892)#31 | 0.19%(+1.30)#713 |
| 32. | Northborough | 1.47% | 0.60%(+0.871)#32 | 0.19%(+1.28)#729 |
| 33. | South Duxbury | 1.44% | 0.60%(+0.841)#33 | 0.19%(+1.25)#741 |
| 34. | Great Barrington | 1.43% | 0.60%(+0.832)#34 | 0.19%(+1.24)#746 |
| 35. | East Falmouth | 1.40% | 0.60%(+0.807)#35 | 0.19%(+1.22)#764 |
| 36. | North Brookfield | 1.31% | 0.60%(+0.717)#36 | 0.19%(+1.13)#826 |
| 37. | Peabody | 1.30% | 0.60%(+0.699)#37 | 0.19%(+1.11)#836 |
| 38. | Shelburne Falls | 1.29% | 0.60%(+0.699)#38 | 0.19%(+1.11)#837 |
| 39. | Longmeadow | 1.29% | 0.60%(+0.689)#39 | 0.19%(+1.10)#843 |
| 40. | Teaticket | 1.28% | 0.60%(+0.685)#40 | 0.19%(+1.10)#844 |
| 41. | Wilbraham | 1.28% | 0.60%(+0.680)#41 | 0.19%(+1.09)#847 |
| 42. | Northampton | 1.27% | 0.60%(+0.678)#42 | 0.19%(+1.09)#849 |
| 43. | South Ashburnham | 1.24% | 0.60%(+0.643)#43 | 0.19%(+1.05)#879 |
| 44. | New Seabury | 1.22% | 0.60%(+0.623)#44 | 0.19%(+1.03)#896 |
| 45. | Shirley | 1.18% | 0.60%(+0.581)#45 | 0.19%(+0.992)#937 |
| 46. | Maynard | 1.12% | 0.60%(+0.528)#46 | 0.19%(+0.939)#981 |
| 47. | Greenfield | 1.11% | 0.60%(+0.518)#47 | 0.19%(+0.929)#999 |
| 48. | Winthrop Town | 1.11% | 0.60%(+0.518)#48 | 0.19%(+0.929)#1,000 |
| 49. | Yarmouth Port | 1.11% | 0.60%(+0.509)#49 | 0.19%(+0.920)#1,010 |
| 50. | Pocasset | 1.10% | 0.60%(+0.508)#50 | 0.19%(+0.919)#1,012 |
| 51. | Norwood | 1.08% | 0.60%(+0.488)#51 | 0.19%(+0.900)#1,036 |
| 52. | Kingston | 1.08% | 0.60%(+0.487)#52 | 0.19%(+0.899)#1,039 |
| 53. | Medfield | 1.06% | 0.60%(+0.464)#53 | 0.19%(+0.875)#1,074 |
| 54. | Northwest Harwich | 1.05% | 0.60%(+0.459)#54 | 0.19%(+0.870)#1,081 |
| 55. | Braintree Town | 1.02% | 0.60%(+0.428)#55 | 0.19%(+0.839)#1,114 |
| 56. | North Plymouth | 1.02% | 0.60%(+0.422)#56 | 0.19%(+0.833)#1,122 |
| 57. | Swampscott | 1.02% | 0.60%(+0.422)#57 | 0.19%(+0.833)#1,124 |
| 58. | Hingham | 1.02% | 0.60%(+0.420)#58 | 0.19%(+0.832)#1,126 |
| 59. | Arlington | 1.01% | 0.60%(+0.412)#59 | 0.19%(+0.823)#1,138 |
| 60. | Lynnfield | 1.01% | 0.60%(+0.410)#60 | 0.19%(+0.821)#1,146 |
| 61. | Cochituate | 0.98% | 0.60%(+0.384)#61 | 0.19%(+0.795)#1,184 |
| 62. | Chatham | 0.98% | 0.60%(+0.381)#62 | 0.19%(+0.792)#1,189 |
| 63. | South Dennis | 0.97% | 0.60%(+0.371)#63 | 0.19%(+0.782)#1,205 |
| 64. | Upton | 0.96% | 0.60%(+0.367)#64 | 0.19%(+0.778)#1,213 |
| 65. | Gardner | 0.96% | 0.60%(+0.362)#65 | 0.19%(+0.773)#1,221 |
| 66. | Newburyport | 0.95% | 0.60%(+0.357)#66 | 0.19%(+0.768)#1,232 |
| 67. | Foxborough | 0.95% | 0.60%(+0.354)#67 | 0.19%(+0.765)#1,236 |
| 68. | Pinehurst | 0.95% | 0.60%(+0.353)#68 | 0.19%(+0.764)#1,238 |
| 69. | Newton | 0.95% | 0.60%(+0.352)#69 | 0.19%(+0.763)#1,239 |
| 70. | Ayer | 0.94% | 0.60%(+0.347)#70 | 0.19%(+0.758)#1,250 |
| 71. | Hull | 0.94% | 0.60%(+0.343)#71 | 0.19%(+0.754)#1,255 |
| 72. | Hudson | 0.94% | 0.60%(+0.339)#72 | 0.19%(+0.751)#1,261 |
| 73. | Belmont | 0.93% | 0.60%(+0.333)#73 | 0.19%(+0.745)#1,276 |
| 74. | Huntington | 0.92% | 0.60%(+0.329)#74 | 0.19%(+0.740)#1,287 |
| 75. | West Brookfield | 0.91% | 0.60%(+0.318)#75 | 0.19%(+0.729)#1,304 |
| 76. | Hatfield | 0.90% | 0.60%(+0.305)#76 | 0.19%(+0.716)#1,326 |
| 77. | Wakefield | 0.89% | 0.60%(+0.291)#77 | 0.19%(+0.702)#1,365 |
| 78. | Groton | 0.88% | 0.60%(+0.287)#78 | 0.19%(+0.698)#1,370 |
| 79. | Dover | 0.88% | 0.60%(+0.280)#79 | 0.19%(+0.691)#1,376 |
| 80. | Webster | 0.86% | 0.60%(+0.268)#80 | 0.19%(+0.679)#1,393 |
| 81. | Sagamore | 0.86% | 0.60%(+0.261)#81 | 0.19%(+0.672)#1,411 |
| 82. | Rowley | 0.85% | 0.60%(+0.256)#82 | 0.19%(+0.667)#1,420 |
| 83. | Marblehead | 0.84% | 0.60%(+0.239)#83 | 0.19%(+0.650)#1,456 |
| 84. | Methuen Town | 0.82% | 0.60%(+0.225)#84 | 0.19%(+0.637)#1,488 |
| 85. | Pepperell | 0.82% | 0.60%(+0.220)#85 | 0.19%(+0.631)#1,504 |
| 86. | Worcester | 0.80% | 0.60%(+0.208)#86 | 0.19%(+0.619)#1,520 |
| 87. | Lenox | 0.75% | 0.60%(+0.154)#87 | 0.19%(+0.565)#1,634 |
| 88. | Scituate | 0.74% | 0.60%(+0.139)#88 | 0.19%(+0.550)#1,661 |
| 89. | Hopedale | 0.70% | 0.60%(+0.105)#89 | 0.19%(+0.516)#1,739 |
| 90. | Somerville | 0.70% | 0.60%(+0.105)#90 | 0.19%(+0.516)#1,740 |
| 91. | Spencer | 0.69% | 0.60%(+0.096)#91 | 0.19%(+0.507)#1,764 |
| 92. | Lexington | 0.68% | 0.60%(+0.088)#92 | 0.19%(+0.499)#1,792 |
| 93. | Barnstable Town | 0.67% | 0.60%(+0.076)#93 | 0.19%(+0.487)#1,814 |
| 94. | Stoneham | 0.67% | 0.60%(+0.069)#94 | 0.19%(+0.480)#1,829 |
| 95. | Orleans | 0.66% | 0.60%(+0.064)#95 | 0.19%(+0.475)#1,842 |
| 96. | West Concord | 0.65% | 0.60%(+0.055)#96 | 0.19%(+0.466)#1,863 |
| 97. | Danvers | 0.64% | 0.60%(+0.049)#97 | 0.19%(+0.460)#1,884 |
| 98. | Milton | 0.64% | 0.60%(+0.047)#98 | 0.19%(+0.458)#1,887 |
| 99. | Topsfield | 0.64% | 0.60%(+0.047)#99 | 0.19%(+0.458)#1,889 |
| 100. | Provincetown | 0.64% | 0.60%(+0.045)#100 | 0.19%(+0.456)#1,901 |
Common Questions
What are the Top 10 Cities with the Highest Percentage of Lithuanian Population in Massachusetts?
Top 10 Cities with the Highest Percentage of Lithuanian Population in Massachusetts are:
#1
14.29%
#2
9.27%
#3
7.32%
#4
4.38%
#5
3.74%
#6
3.65%
#7
3.64%
#8
3.41%
#9
3.24%
#10
2.93%
What city has the Highest Percentage of Lithuanian Population in Massachusetts?
Popponesset Island has the Highest Percentage of Lithuanian Population in Massachusetts with 14.29%.
What is the Percentage of Lithuanian Population in the State of Massachusetts?
Percentage of Lithuanian Population in Massachusetts is 0.60%.
What is the Percentage of Lithuanian Population in the United States?
Percentage of Lithuanian Population in the United States is 0.19%.