Cities with the Highest Percentage of Venezuelan Population in Alabama

RELATED REPORTS & OPTIONS

Venezuelan
Population
Families and Households
Female Fertility
Female Fertility (Unmarried)
Race (Community Size)
Race (Percentage)
Ancestry (Community Size)
AfghanAfricanAlaska NativeAlaskan AthabascanAlbanianAleutAlsatianAmericanApacheArabArapahoArgentineanArmenianAssyrian / Chaldean / SyriacAustralianAustrianBahamianBangladeshiBarbadianBasqueBelgianBelizeanBermudanBhutaneseBlackfeetBolivianBrazilianBritishBritish West IndianBulgarianBurmeseCajunCambodianCanadianCape VerdeanCarpatho RusynCelticCentral AmericanCentral American IndianCherokeeCheyenneChickasawChileanChineseChippewaChoctawColombianColvilleComancheCosta RicanCreeCreekCroatianCrowCubanCypriotCzechCzechoslovakianDanishDelawareDominicanDutchDutch West IndianEastern EuropeanEcuadorianEgyptianEnglishEstonianEthiopianEuropeanFijianFilipinoFinnishFrenchFrench American IndianFrench CanadianGermanGerman RussianGhanaianGreekGuamanian / ChamorroGuatemalanGuyaneseHaitianHmongHonduranHopiHoumaHungarianIcelanderIndian (Asian)IndonesianInupiatIranianIraqiIrishIroquoisIsraeliItalianJamaicanJapaneseJordanianKenyanKiowaKoreanLaotianLatvianLebaneseLiberianLithuanianLumbeeLuxembourgerMacedonianMalaysianMalteseMarshalleseMenomineeMexicanMexican American IndianMongolianMoroccanNative HawaiianNavajoNepaleseNew ZealanderNicaraguanNigerianNorthern EuropeanNorwegianOkinawanOsageOttawaPaiutePakistaniPalestinianPanamanianParaguayanPennsylvania GermanPeruvianPimaPolishPortuguesePotawatomiPuebloPuerto RicanPuget Sound SalishRomanianRussianSalvadoranSamoanScandinavianScotch-IrishScottishSeminoleSenegaleseSerbianShoshoneSierra LeoneanSiouxSlavicSlovakSloveneSomaliSouth AfricanSouth AmericanSouth American IndianSoviet UnionSpaniardSpanishSpanish AmericanSpanish American IndianSri LankanSubsaharan AfricanSudaneseSwedishSwissSyrianTaiwaneseThaiTlingit-HaidaTohono O'OdhamTonganTrinidadian and TobagonianTsimshianTurkishU.S. Virgin IslanderUgandanUkrainianUruguayanUteVenezuelanVietnameseWelshWest IndianYakamaYaquiYugoslavianYumanYup'ikZimbabwean
Ancestry (Percentage)
AfghanAfricanAlaska NativeAlaskan AthabascanAlbanianAleutAlsatianAmericanApacheArabArapahoArgentineanArmenianAssyrian / Chaldean / SyriacAustralianAustrianBahamianBangladeshiBarbadianBasqueBelgianBelizeanBermudanBhutaneseBlackfeetBolivianBrazilianBritishBritish West IndianBulgarianBurmeseCajunCambodianCanadianCape VerdeanCarpatho RusynCelticCentral AmericanCentral American IndianCherokeeCheyenneChickasawChileanChineseChippewaChoctawColombianColvilleComancheCosta RicanCreeCreekCroatianCrowCubanCypriotCzechCzechoslovakianDanishDelawareDominicanDutchDutch West IndianEastern EuropeanEcuadorianEgyptianEnglishEstonianEthiopianEuropeanFijianFilipinoFinnishFrenchFrench American IndianFrench CanadianGermanGerman RussianGhanaianGreekGuamanian / ChamorroGuatemalanGuyaneseHaitianHmongHonduranHopiHoumaHungarianIcelanderIndian (Asian)IndonesianInupiatIranianIraqiIrishIroquoisIsraeliItalianJamaicanJapaneseJordanianKenyanKiowaKoreanLaotianLatvianLebaneseLiberianLithuanianLumbeeLuxembourgerMacedonianMalaysianMalteseMarshalleseMenomineeMexicanMexican American IndianMongolianMoroccanNative HawaiianNavajoNepaleseNew ZealanderNicaraguanNigerianNorthern EuropeanNorwegianOkinawanOsageOttawaPaiutePakistaniPalestinianPanamanianParaguayanPennsylvania GermanPeruvianPimaPolishPortuguesePotawatomiPuebloPuerto RicanPuget Sound SalishRomanianRussianSalvadoranSamoanScandinavianScotch-IrishScottishSeminoleSenegaleseSerbianShoshoneSierra LeoneanSiouxSlavicSlovakSloveneSomaliSouth AfricanSouth AmericanSouth American IndianSoviet UnionSpaniardSpanishSpanish AmericanSpanish American IndianSri LankanSubsaharan AfricanSudaneseSwedishSwissSyrianTaiwaneseThaiTlingit-HaidaTohono O'OdhamTonganTrinidadian and TobagonianTsimshianTurkishU.S. Virgin IslanderUgandanUkrainianUruguayanUteVenezuelanVietnameseWelshWest IndianYakamaYaquiYugoslavianYumanYup'ikZimbabwean
Immigrant Origin (Total)
AfghanistanAfricaAlbaniaArgentinaArmeniaAsiaAustraliaAustriaAzoresBahamasBangladeshBarbadosBelarusBelgiumBelizeBoliviaBosnia and HerzegovinaBrazilBulgariaBurma / MyanmarCabo VerdeCambodiaCameroonCanadaCaribbeanCentral AmericaChileChinaColombiaCongoCosta RicaCroatiaCubaCzechoslovakiaDenmarkDominicaDominican RepublicEastern AfricaEastern AsiaEastern EuropeEcuadorEgyptEl SalvadorEnglandEritreaEthiopiaEuropeFijiFranceGermanyGhanaGreeceGrenadaGuatemalaGuyanaHaitiHondurasHong KongHungaryIndiaIndonesiaIranIraqIrelandIsraelItalyJamaicaJapanJordanKazakhstanKenyaKoreaKuwaitLaosLatin AmericaLatviaLebanonLiberiaLithuaniaMalaysiaMexicoMicronesiaMiddle AfricaMoldovaMoroccoNepalNetherlandsNicaraguaNigeriaNorth MacedoniaNorthern AfricaNorthern EuropeNorwayOceaniaPakistanPanamaPeruPhilippinesPolandPortugalRomaniaRussiaSaudi ArabiaScotlandSenegalSerbiaSierra LeoneSingaporeSomaliaSouth AfricaSouth AmericaSouth Central AsiaSouth Eastern AsiaSouthern EuropeSpainSri LankaSt. Vincent and the GrenadinesSudanSwedenSwitzerlandSyriaTaiwanThailandTrinidad and TobagoTurkeyUgandaUkraineUruguayUzbekistanVenezuelaVietnamWest IndiesWestern AfricaWestern AsiaWestern EuropeYemenZaireZimbabwe
Immigrant Origin (Percentage)
AfghanistanAfricaAlbaniaArgentinaArmeniaAsiaAustraliaAustriaAzoresBahamasBangladeshBarbadosBelarusBelgiumBelizeBoliviaBosnia and HerzegovinaBrazilBulgariaBurma / MyanmarCabo VerdeCambodiaCameroonCanadaCaribbeanCentral AmericaChileChinaColombiaCongoCosta RicaCroatiaCubaCzechoslovakiaDenmarkDominicaDominican RepublicEastern AfricaEastern AsiaEastern EuropeEcuadorEgyptEl SalvadorEnglandEritreaEthiopiaEuropeFijiFranceGermanyGhanaGreeceGrenadaGuatemalaGuyanaHaitiHondurasHong KongHungaryIndiaIndonesiaIranIraqIrelandIsraelItalyJamaicaJapanJordanKazakhstanKenyaKoreaKuwaitLaosLatin AmericaLatviaLebanonLiberiaLithuaniaMalaysiaMexicoMicronesiaMiddle AfricaMoldovaMoroccoNepalNetherlandsNicaraguaNigeriaNorth MacedoniaNorthern AfricaNorthern EuropeNorwayOceaniaPakistanPanamaPeruPhilippinesPolandPortugalRomaniaRussiaSaudi ArabiaScotlandSenegalSerbiaSierra LeoneSingaporeSomaliaSouth AfricaSouth AmericaSouth Central AsiaSouth Eastern AsiaSouthern EuropeSpainSri LankaSt. Vincent and the GrenadinesSudanSwedenSwitzerlandSyriaTaiwanThailandTrinidad and TobagoTurkeyUgandaUkraineUruguayUzbekistanVenezuelaVietnamWest IndiesWestern AfricaWestern AsiaWestern EuropeYemenZaireZimbabwe
Income
Income (Families)
Income (Households)
Poverty
Poverty (Families)
Unemployment
Employment Occupations
Employment Industries
Employer Class
Commute Time
Commute Means
School Enrollment
Education by Degree Field
Occupancy
Finances
Physical Characteristics
Alabama
Compare Cities
Comparison Subject

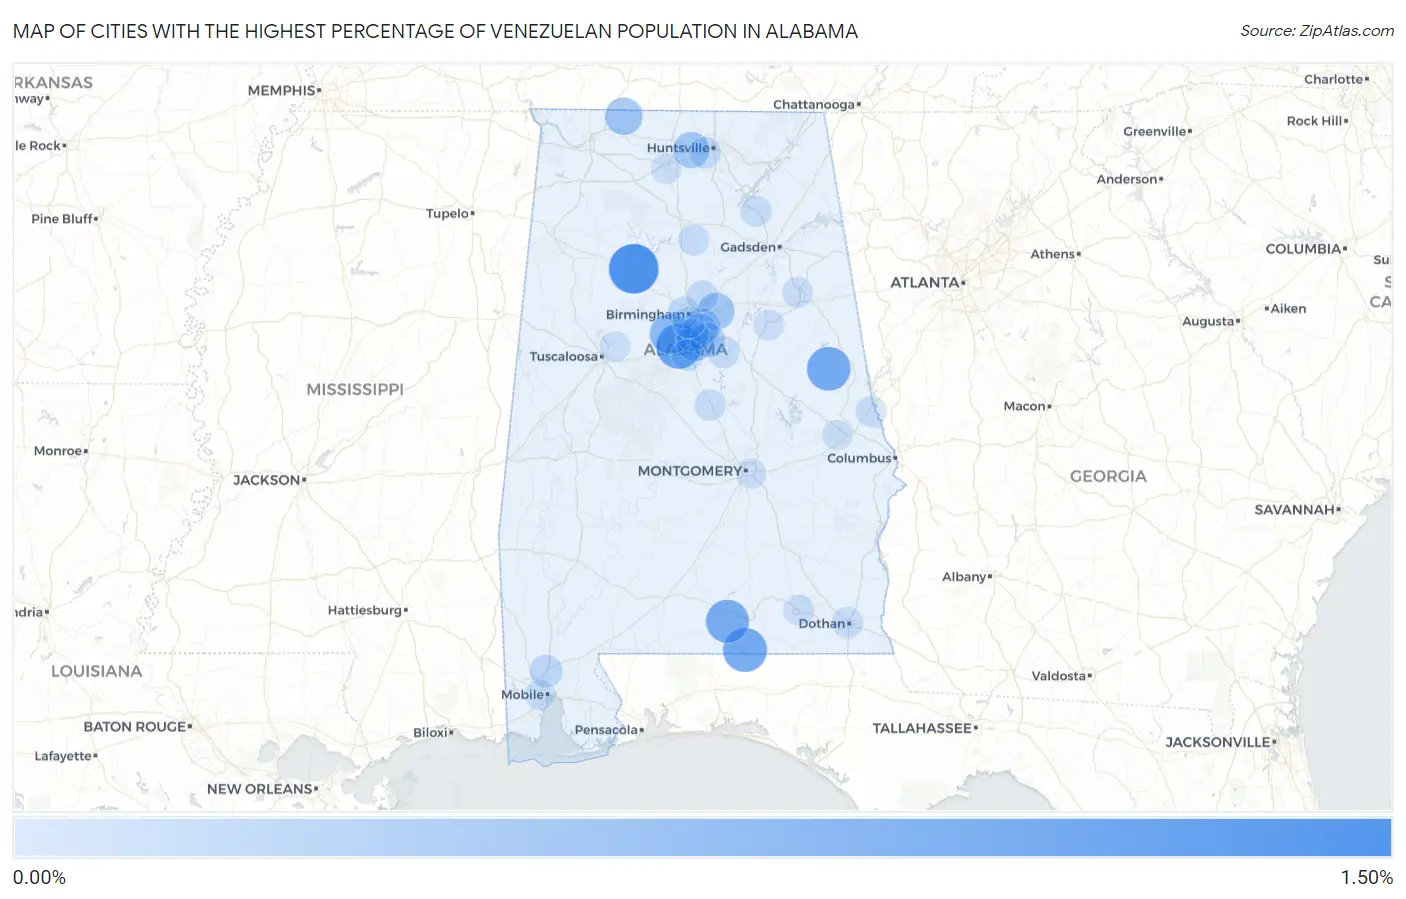
Map of Cities with the Highest Percentage of Venezuelan Population in Alabama

0.00%
1.50%
Cities with the Highest Percentage of Venezuelan Population in Alabama Map

Cities with the Highest Percentage of Venezuelan Population in Alabama

City Venezuelan vs State vs National
1.Jasper1.37%0.044%(+1.33)#10.19%(+1.18)#271
2.Helena1.03%0.044%(+0.988)#20.19%(+0.842)#375
3.Florala0.97%0.044%(+0.930)#30.19%(+0.785)#398
4.Wadley0.95%0.044%(+0.904)#40.19%(+0.758)#413
5.Libertyville0.90%0.044%(+0.857)#50.19%(+0.711)#432
6.Bessemer0.71%0.044%(+0.663)#60.19%(+0.517)#554
7.Lexington0.50%0.044%(+0.453)#70.19%(+0.307)#738
8.Pelham0.48%0.044%(+0.435)#80.19%(+0.289)#754
9.Leeds0.45%0.044%(+0.404)#90.19%(+0.258)#793
10.Madison0.42%0.044%(+0.374)#100.19%(+0.228)#827
11.Brook Highland0.36%0.044%(+0.318)#110.19%(+0.172)#908
12.Meadowbrook0.34%0.044%(+0.299)#120.19%(+0.153)#954
13.Chelsea0.30%0.044%(+0.252)#130.19%(+0.106)#1,060
14.Satsuma0.18%0.044%(+0.134)#140.19%(-0.012)#1,420
15.Hoover0.17%0.044%(+0.126)#150.19%(-0.020)#1,456
16.Alabaster0.12%0.044%(+0.076)#160.19%(-0.070)#1,714
17.Birmingham0.11%0.044%(+0.070)#170.19%(-0.076)#1,756
18.Homewood0.11%0.044%(+0.069)#180.19%(-0.077)#1,761
19.Huntsville0.11%0.044%(+0.062)#190.19%(-0.084)#1,804
20.Center Point0.10%0.044%(+0.061)#200.19%(-0.085)#1,817
21.Wilsonville0.10%0.044%(+0.056)#210.19%(-0.090)#1,844
22.Albertville0.076%0.044%(+0.032)#220.19%(-0.114)#2,020
23.Dothan0.072%0.044%(+0.028)#230.19%(-0.118)#2,054
24.Hanceville0.062%0.044%(+0.018)#240.19%(-0.127)#2,129
25.Valley0.057%0.044%(+0.014)#250.19%(-0.132)#2,158
26.Clanton0.057%0.044%(+0.013)#260.19%(-0.133)#2,163
27.Talladega0.046%0.044%(+0.003)#270.19%(-0.143)#2,262
28.Enterprise0.046%0.044%(+0.002)#280.19%(-0.144)#2,274
29.Anniston0.042%0.044%(-0.002)#290.19%(-0.148)#2,311
30.Montgomery0.032%0.044%(-0.012)#300.19%(-0.158)#2,401
31.Auburn0.031%0.044%(-0.012)#310.19%(-0.158)#2,406
32.Tuscaloosa0.031%0.044%(-0.013)#320.19%(-0.158)#2,407
33.Decatur0.030%0.044%(-0.014)#330.19%(-0.160)#2,418
34.Mobile0.023%0.044%(-0.021)#340.19%(-0.167)#2,487

Common Questions

What are the Top 10 Cities with the Highest Percentage of Venezuelan Population in Alabama?
Top 10 Cities with the Highest Percentage of Venezuelan Population in Alabama are:
#1
1.37%
#2
1.03%
#3
0.97%
#4
0.95%
#5
0.90%
#6
0.71%
#7
0.50%
#8
0.48%
#9
0.45%
#10
0.42%
What city has the Highest Percentage of Venezuelan Population in Alabama?
Jasper has the Highest Percentage of Venezuelan Population in Alabama with 1.37%.
What is the Percentage of Venezuelan Population in the State of Alabama?
Percentage of Venezuelan Population in Alabama is 0.044%.
What is the Percentage of Venezuelan Population in the United States?
Percentage of Venezuelan Population in the United States is 0.19%.