Cities with the Highest Percentage of Venezuelan Population in New York
RELATED REPORTS & OPTIONS
Venezuelan
New York
Compare Cities
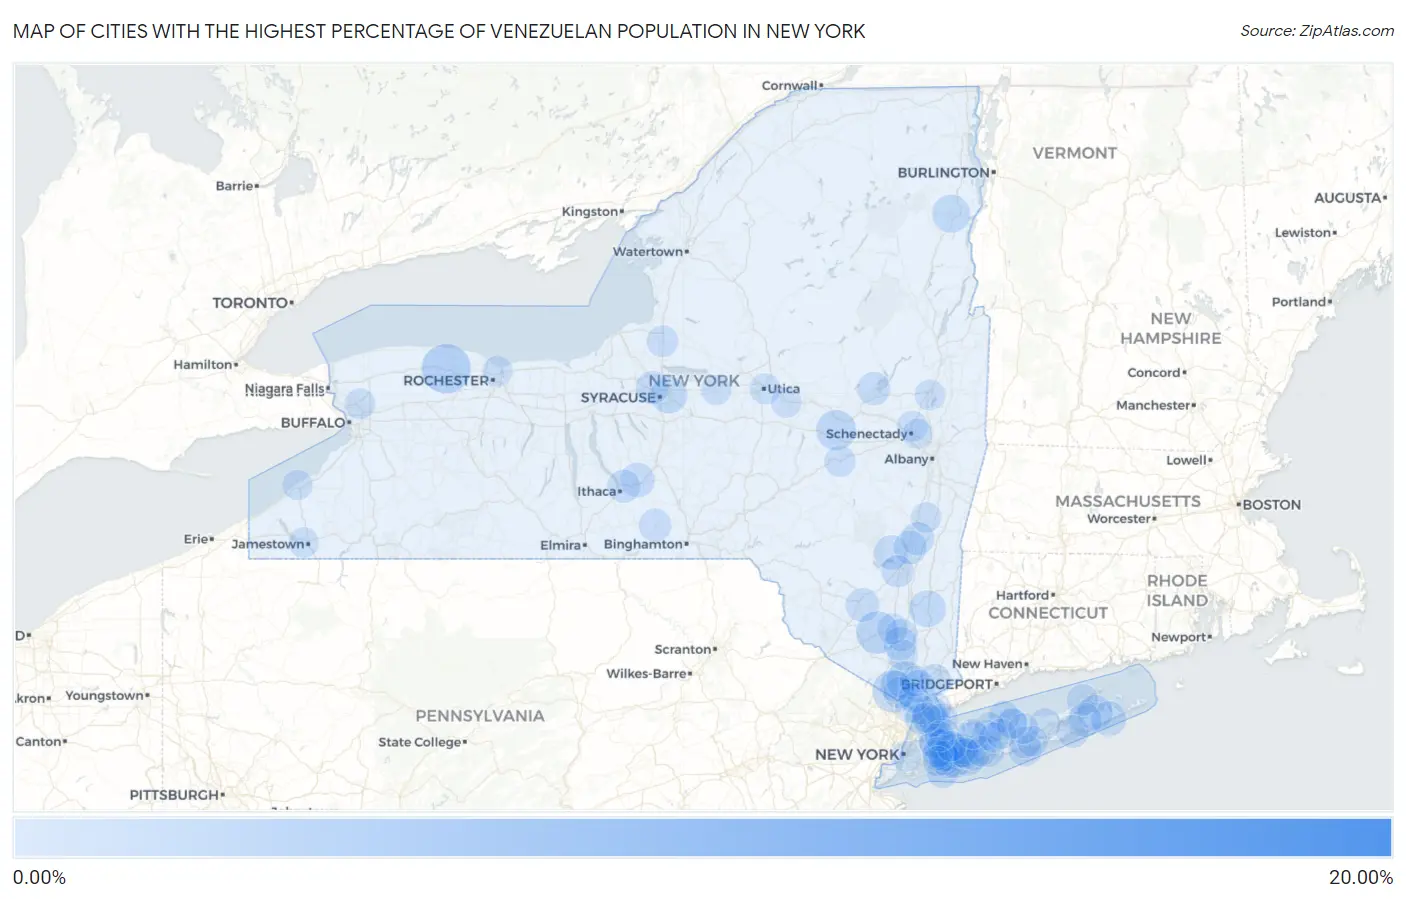
Map of Cities with the Highest Percentage of Venezuelan Population in New York
0.00%
20.00%
Cities with the Highest Percentage of Venezuelan Population in New York
| City | Venezuelan | vs State | vs National | |
| 1. | Westernville | 19.90% | 0.12%(+19.8)#1 | 0.19%(+19.7)#7 |
| 2. | Danby | 6.29% | 0.12%(+6.17)#2 | 0.19%(+6.10)#35 |
| 3. | Holley | 3.39% | 0.12%(+3.27)#3 | 0.19%(+3.20)#88 |
| 4. | Viola | 2.25% | 0.12%(+2.13)#4 | 0.19%(+2.06)#156 |
| 5. | Montgomery | 2.19% | 0.12%(+2.06)#5 | 0.19%(+2.00)#159 |
| 6. | Ames | 1.81% | 0.12%(+1.69)#6 | 0.19%(+1.62)#210 |
| 7. | Bard College | 1.45% | 0.12%(+1.33)#7 | 0.19%(+1.26)#256 |
| 8. | Elizabethtown | 1.45% | 0.12%(+1.32)#8 | 0.19%(+1.26)#257 |
| 9. | West Haverstraw | 1.35% | 0.12%(+1.23)#9 | 0.19%(+1.16)#275 |
| 10. | Williston Park | 1.31% | 0.12%(+1.19)#10 | 0.19%(+1.12)#292 |
| 11. | East Syracuse | 1.27% | 0.12%(+1.15)#11 | 0.19%(+1.08)#301 |
| 12. | Freedom Plains | 1.25% | 0.12%(+1.13)#12 | 0.19%(+1.06)#309 |
| 13. | Setauket | 1.02% | 0.12%(+0.895)#13 | 0.19%(+0.827)#381 |
| 14. | Great Neck Gardens | 0.97% | 0.12%(+0.844)#14 | 0.19%(+0.776)#404 |
| 15. | Noyack | 0.96% | 0.12%(+0.837)#15 | 0.19%(+0.769)#407 |
| 16. | East Hampton | 0.94% | 0.12%(+0.823)#16 | 0.19%(+0.755)#415 |
| 17. | Woodstock | 0.87% | 0.12%(+0.748)#17 | 0.19%(+0.681)#449 |
| 18. | Freeville | 0.85% | 0.12%(+0.733)#18 | 0.19%(+0.665)#459 |
| 19. | East Massapequa | 0.77% | 0.12%(+0.647)#19 | 0.19%(+0.579)#504 |
| 20. | Ellenville | 0.76% | 0.12%(+0.638)#20 | 0.19%(+0.570)#508 |
| 21. | North Sea | 0.74% | 0.12%(+0.622)#21 | 0.19%(+0.554)#523 |
| 22. | Scarsdale | 0.71% | 0.12%(+0.593)#22 | 0.19%(+0.525)#546 |
| 23. | Saugerties | 0.69% | 0.12%(+0.572)#23 | 0.19%(+0.504)#563 |
| 24. | Firthcliffe | 0.68% | 0.12%(+0.562)#24 | 0.19%(+0.494)#569 |
| 25. | Germantown | 0.66% | 0.12%(+0.534)#25 | 0.19%(+0.466)#584 |
| 26. | Liverpool | 0.64% | 0.12%(+0.522)#26 | 0.19%(+0.454)#592 |
| 27. | Mayfield | 0.64% | 0.12%(+0.518)#27 | 0.19%(+0.450)#598 |
| 28. | Northeast Ithaca | 0.61% | 0.12%(+0.487)#28 | 0.19%(+0.419)#623 |
| 29. | Bellport | 0.60% | 0.12%(+0.475)#29 | 0.19%(+0.407)#641 |
| 30. | Hampton Bays | 0.56% | 0.12%(+0.439)#30 | 0.19%(+0.371)#673 |
| 31. | Newark Valley | 0.56% | 0.12%(+0.434)#31 | 0.19%(+0.366)#677 |
| 32. | Ossining | 0.54% | 0.12%(+0.418)#32 | 0.19%(+0.350)#696 |
| 33. | Newburgh | 0.50% | 0.12%(+0.379)#33 | 0.19%(+0.311)#733 |
| 34. | Hurley | 0.47% | 0.12%(+0.353)#34 | 0.19%(+0.285)#760 |
| 35. | Mount Kisco | 0.45% | 0.12%(+0.331)#35 | 0.19%(+0.263)#789 |
| 36. | New Rochelle | 0.40% | 0.12%(+0.280)#36 | 0.19%(+0.212)#852 |
| 37. | South Huntington | 0.38% | 0.12%(+0.257)#37 | 0.19%(+0.189)#888 |
| 38. | Parish | 0.36% | 0.12%(+0.239)#38 | 0.19%(+0.171)#915 |
| 39. | Hempstead | 0.35% | 0.12%(+0.232)#39 | 0.19%(+0.164)#930 |
| 40. | Southold | 0.34% | 0.12%(+0.223)#40 | 0.19%(+0.155)#948 |
| 41. | North Bellport | 0.34% | 0.12%(+0.220)#41 | 0.19%(+0.152)#955 |
| 42. | Calverton | 0.34% | 0.12%(+0.215)#42 | 0.19%(+0.147)#964 |
| 43. | Salisbury | 0.32% | 0.12%(+0.197)#43 | 0.19%(+0.129)#1,001 |
| 44. | Bay Shore | 0.32% | 0.12%(+0.196)#44 | 0.19%(+0.128)#1,003 |
| 45. | Mamaroneck | 0.32% | 0.12%(+0.194)#45 | 0.19%(+0.126)#1,007 |
| 46. | Long Beach | 0.31% | 0.12%(+0.192)#46 | 0.19%(+0.124)#1,013 |
| 47. | Richmondville | 0.31% | 0.12%(+0.183)#47 | 0.19%(+0.116)#1,043 |
| 48. | Spring Valley | 0.30% | 0.12%(+0.179)#48 | 0.19%(+0.111)#1,051 |
| 49. | Old Field | 0.29% | 0.12%(+0.172)#49 | 0.19%(+0.104)#1,067 |
| 50. | Great Neck Plaza | 0.28% | 0.12%(+0.160)#50 | 0.19%(+0.092)#1,099 |
| 51. | Baldwin | 0.28% | 0.12%(+0.157)#51 | 0.19%(+0.089)#1,111 |
| 52. | East Glenville | 0.27% | 0.12%(+0.148)#52 | 0.19%(+0.080)#1,125 |
| 53. | Merrick | 0.26% | 0.12%(+0.140)#53 | 0.19%(+0.072)#1,148 |
| 54. | North Lindenhurst | 0.26% | 0.12%(+0.138)#54 | 0.19%(+0.070)#1,157 |
| 55. | University At Buffalo | 0.26% | 0.12%(+0.137)#55 | 0.19%(+0.069)#1,163 |
| 56. | Searingtown | 0.26% | 0.12%(+0.134)#56 | 0.19%(+0.066)#1,176 |
| 57. | West Point | 0.25% | 0.12%(+0.129)#57 | 0.19%(+0.061)#1,189 |
| 58. | Utica | 0.25% | 0.12%(+0.129)#58 | 0.19%(+0.061)#1,190 |
| 59. | Orange Lake | 0.25% | 0.12%(+0.127)#59 | 0.19%(+0.059)#1,193 |
| 60. | Wesley Hills | 0.24% | 0.12%(+0.123)#60 | 0.19%(+0.055)#1,204 |
| 61. | Dobbs Ferry | 0.24% | 0.12%(+0.123)#61 | 0.19%(+0.055)#1,205 |
| 62. | Rye | 0.24% | 0.12%(+0.115)#62 | 0.19%(+0.047)#1,228 |
| 63. | Vassar College | 0.23% | 0.12%(+0.111)#63 | 0.19%(+0.043)#1,243 |
| 64. | Rockville Centre | 0.21% | 0.12%(+0.088)#64 | 0.19%(+0.020)#1,306 |
| 65. | Ilion | 0.21% | 0.12%(+0.086)#65 | 0.19%(+0.018)#1,309 |
| 66. | Irondequoit | 0.20% | 0.12%(+0.083)#66 | 0.19%(+0.015)#1,320 |
| 67. | Tappan | 0.20% | 0.12%(+0.078)#67 | 0.19%(+0.010)#1,345 |
| 68. | New York | 0.20% | 0.12%(+0.077)#68 | 0.19%(+0.009)#1,348 |
| 69. | Yonkers | 0.20% | 0.12%(+0.075)#69 | 0.19%(+0.007)#1,355 |
| 70. | Saratoga Springs | 0.19% | 0.12%(+0.071)#70 | 0.19%(+0.003)#1,366 |
| 71. | Shirley | 0.19% | 0.12%(+0.067)#71 | 0.19%(-0.001)#1,381 |
| 72. | Port Jefferson Station | 0.19% | 0.12%(+0.066)#72 | 0.19%(-0.002)#1,385 |
| 73. | Bethpage | 0.19% | 0.12%(+0.063)#73 | 0.19%(-0.004)#1,393 |
| 74. | Croton On Hudson | 0.18% | 0.12%(+0.060)#74 | 0.19%(-0.008)#1,405 |
| 75. | Sea Cliff | 0.18% | 0.12%(+0.056)#75 | 0.19%(-0.012)#1,423 |
| 76. | Middle Island | 0.18% | 0.12%(+0.055)#76 | 0.19%(-0.013)#1,428 |
| 77. | West Hempstead | 0.17% | 0.12%(+0.050)#77 | 0.19%(-0.018)#1,446 |
| 78. | Levittown | 0.17% | 0.12%(+0.050)#78 | 0.19%(-0.018)#1,448 |
| 79. | Kings Park | 0.17% | 0.12%(+0.046)#79 | 0.19%(-0.022)#1,472 |
| 80. | Terryville | 0.17% | 0.12%(+0.044)#80 | 0.19%(-0.024)#1,482 |
| 81. | Commack | 0.16% | 0.12%(+0.043)#81 | 0.19%(-0.025)#1,487 |
| 82. | Athens | 0.16% | 0.12%(+0.043)#82 | 0.19%(-0.025)#1,488 |
| 83. | Elmont | 0.16% | 0.12%(+0.039)#83 | 0.19%(-0.029)#1,504 |
| 84. | Nyack | 0.16% | 0.12%(+0.034)#84 | 0.19%(-0.034)#1,531 |
| 85. | Celoron | 0.15% | 0.12%(+0.031)#85 | 0.19%(-0.037)#1,541 |
| 86. | Floral Park | 0.15% | 0.12%(+0.029)#86 | 0.19%(-0.039)#1,553 |
| 87. | Niskayuna | 0.15% | 0.12%(+0.029)#87 | 0.19%(-0.039)#1,557 |
| 88. | South Farmingdale | 0.15% | 0.12%(+0.025)#88 | 0.19%(-0.043)#1,576 |
| 89. | Plainedge | 0.15% | 0.12%(+0.023)#89 | 0.19%(-0.045)#1,584 |
| 90. | North Babylon | 0.14% | 0.12%(+0.020)#90 | 0.19%(-0.048)#1,601 |
| 91. | Harrison | 0.14% | 0.12%(+0.014)#91 | 0.19%(-0.054)#1,625 |
| 92. | Westbury | 0.13% | 0.12%(+0.011)#92 | 0.19%(-0.057)#1,639 |
| 93. | Hauppauge | 0.13% | 0.12%(+0.006)#93 | 0.19%(-0.062)#1,675 |
| 94. | Dunkirk | 0.13% | 0.12%(+0.005)#94 | 0.19%(-0.063)#1,680 |
| 95. | Oneida | 0.13% | 0.12%(+0.004)#95 | 0.19%(-0.064)#1,686 |
| 96. | Port Washington | 0.12% | 0.12%(+0.002)#96 | 0.19%(-0.066)#1,693 |
| 97. | Valley Stream | 0.12% | 0.12%(-0.000)#97 | 0.19%(-0.068)#1,699 |
| 98. | Huntington Station | 0.12% | 0.12%(-0.000)#98 | 0.19%(-0.068)#1,701 |
| 99. | Eastchester | 0.12% | 0.12%(-0.001)#99 | 0.19%(-0.068)#1,702 |
| 100. | Nesconset | 0.12% | 0.12%(-0.004)#100 | 0.19%(-0.072)#1,727 |
Common Questions
What are the Top 10 Cities with the Highest Percentage of Venezuelan Population in New York?
Top 10 Cities with the Highest Percentage of Venezuelan Population in New York are:
#1
3.39%
#2
2.25%
#3
2.19%
#4
1.81%
#5
1.45%
#6
1.35%
#7
1.31%
#8
1.27%
#9
1.25%
#10
0.97%
What city has the Highest Percentage of Venezuelan Population in New York?
Holley has the Highest Percentage of Venezuelan Population in New York with 3.39%.
What is the Percentage of Venezuelan Population in the State of New York?
Percentage of Venezuelan Population in New York is 0.12%.
What is the Percentage of Venezuelan Population in the United States?
Percentage of Venezuelan Population in the United States is 0.19%.