Cities with the Highest Percentage of Population Employed in Business & Financial in Virginia
RELATED REPORTS & OPTIONS
Business & Financial
Virginia
Compare Cities
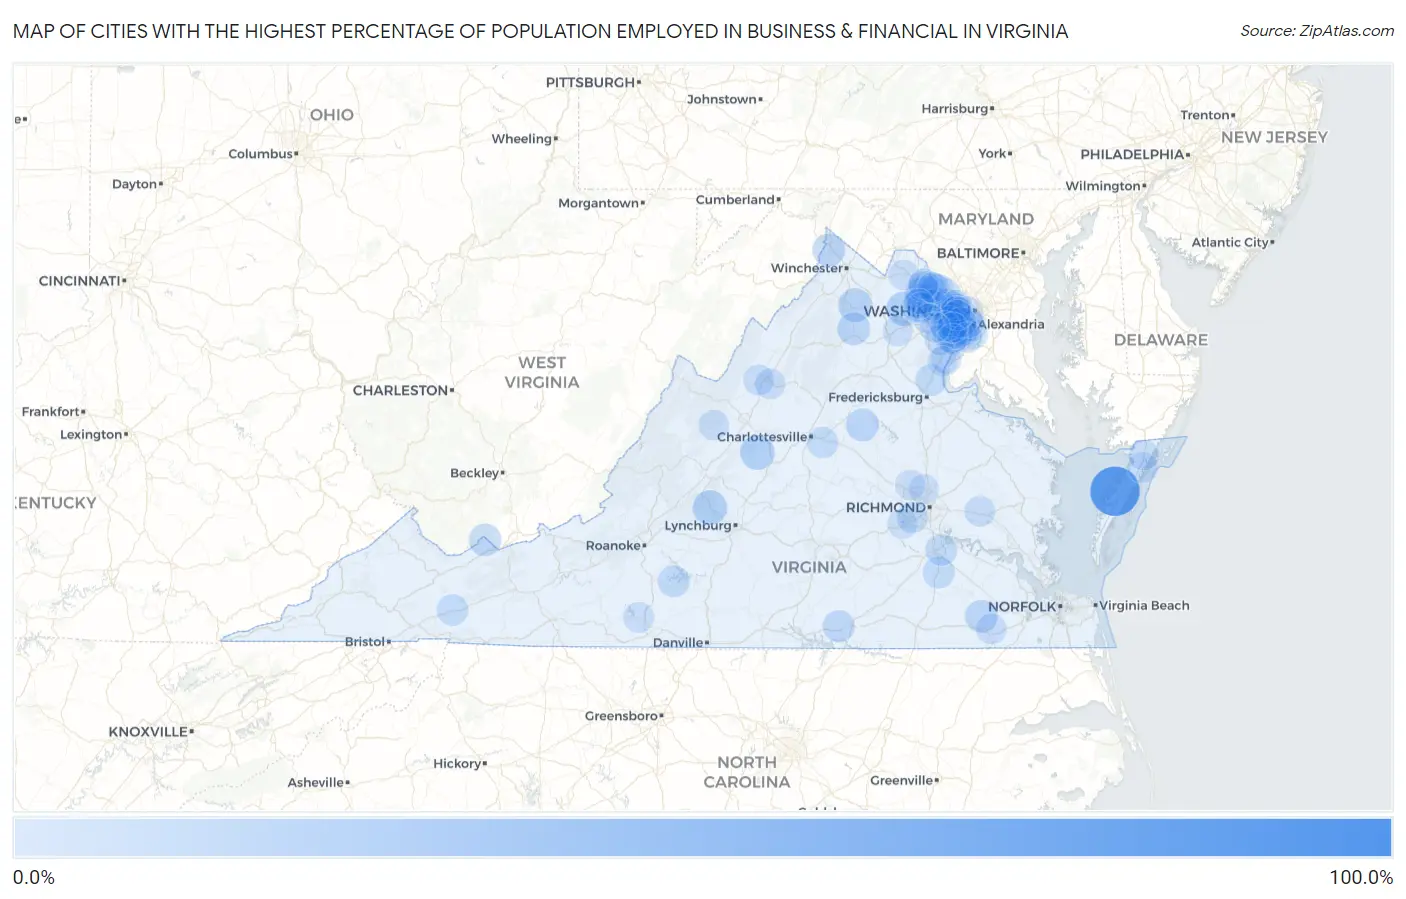
Map of Cities with the Highest Percentage of Population Employed in Business & Financial in Virginia
0.0%
100.0%
Cities with the Highest Percentage of Population Employed in Business & Financial in Virginia
| City | % Employed | vs State | vs National | |
| 1. | Keswick | 100.0% | 7.3%(+92.7)#1 | 5.8%(+94.2)#1 |
| 2. | Bobtown | 86.8% | 7.3%(+79.5)#2 | 5.8%(+81.1)#18 |
| 3. | Big Rock | 53.4% | 7.3%(+46.1)#3 | 5.8%(+47.7)#47 |
| 4. | Weems | 46.8% | 7.3%(+39.5)#4 | 5.8%(+41.1)#64 |
| 5. | Wintergreen | 27.1% | 7.3%(+19.8)#5 | 5.8%(+21.4)#208 |
| 6. | Big Island | 26.9% | 7.3%(+19.6)#6 | 5.8%(+21.2)#212 |
| 7. | Bull Run Mountain Estates | 26.2% | 7.3%(+18.9)#7 | 5.8%(+20.5)#220 |
| 8. | Upperville | 24.4% | 7.3%(+17.1)#8 | 5.8%(+18.6)#255 |
| 9. | Skyland Estates | 23.3% | 7.3%(+15.9)#9 | 5.8%(+17.5)#284 |
| 10. | Blue Ridge Shores | 20.7% | 7.3%(+13.3)#10 | 5.8%(+14.9)#363 |
| 11. | Flint Hill | 20.0% | 7.3%(+12.7)#11 | 5.8%(+14.2)#388 |
| 12. | Sedley | 19.9% | 7.3%(+12.6)#12 | 5.8%(+14.1)#402 |
| 13. | Lake Holiday | 19.8% | 7.3%(+12.5)#13 | 5.8%(+14.1)#403 |
| 14. | Pounding Mill | 19.2% | 7.3%(+11.9)#14 | 5.8%(+13.4)#432 |
| 15. | Pocahontas | 18.8% | 7.3%(+11.4)#15 | 5.8%(+13.0)#455 |
| 16. | Union Level | 17.1% | 7.3%(+9.74)#16 | 5.8%(+11.3)#556 |
| 17. | Union Hall | 16.5% | 7.3%(+9.18)#17 | 5.8%(+10.8)#609 |
| 18. | Templeton | 16.4% | 7.3%(+9.06)#18 | 5.8%(+10.6)#617 |
| 19. | Braddock | 16.2% | 7.3%(+8.84)#19 | 5.8%(+10.4)#648 |
| 20. | Difficult Run | 15.8% | 7.3%(+8.46)#20 | 5.8%(+10.0)#682 |
| 21. | Stafford Courthouse | 15.7% | 7.3%(+8.40)#21 | 5.8%(+9.98)#689 |
| 22. | Arlington | 15.6% | 7.3%(+8.30)#22 | 5.8%(+9.88)#702 |
| 23. | Fort Lee | 15.5% | 7.3%(+8.20)#23 | 5.8%(+9.78)#721 |
| 24. | One Loudoun | 15.5% | 7.3%(+8.19)#24 | 5.8%(+9.77)#722 |
| 25. | South Run | 15.4% | 7.3%(+8.10)#25 | 5.8%(+9.67)#738 |
| 26. | Fair Oaks | 15.4% | 7.3%(+8.05)#26 | 5.8%(+9.63)#744 |
| 27. | Seven Mile Ford | 15.3% | 7.3%(+7.95)#27 | 5.8%(+9.53)#771 |
| 28. | Franklin Farm | 15.0% | 7.3%(+7.71)#28 | 5.8%(+9.29)#795 |
| 29. | Great Falls | 14.8% | 7.3%(+7.49)#29 | 5.8%(+9.06)#827 |
| 30. | Lowes Island | 14.8% | 7.3%(+7.45)#30 | 5.8%(+9.02)#832 |
| 31. | Merrifield | 14.7% | 7.3%(+7.36)#31 | 5.8%(+8.93)#846 |
| 32. | Navy | 14.6% | 7.3%(+7.28)#32 | 5.8%(+8.86)#855 |
| 33. | Vienna | 14.5% | 7.3%(+7.19)#33 | 5.8%(+8.77)#869 |
| 34. | Bastian | 14.5% | 7.3%(+7.12)#34 | 5.8%(+8.70)#879 |
| 35. | Rivanna | 14.4% | 7.3%(+7.04)#35 | 5.8%(+8.61)#889 |
| 36. | Kingstowne | 14.4% | 7.3%(+7.02)#36 | 5.8%(+8.59)#892 |
| 37. | Rockwood | 14.1% | 7.3%(+6.73)#37 | 5.8%(+8.31)#948 |
| 38. | Tysons | 13.7% | 7.3%(+6.35)#38 | 5.8%(+7.92)#1,009 |
| 39. | Stone Ridge | 13.6% | 7.3%(+6.22)#39 | 5.8%(+7.79)#1,042 |
| 40. | Mantua | 13.5% | 7.3%(+6.17)#40 | 5.8%(+7.74)#1,059 |
| 41. | Kings Park | 13.5% | 7.3%(+6.16)#41 | 5.8%(+7.74)#1,063 |
| 42. | Fort Hunt | 13.4% | 7.3%(+6.07)#42 | 5.8%(+7.64)#1,088 |
| 43. | Lorton | 13.4% | 7.3%(+6.04)#43 | 5.8%(+7.62)#1,095 |
| 44. | Loudoun Valley Estates | 13.0% | 7.3%(+5.65)#44 | 5.8%(+7.23)#1,198 |
| 45. | Woodburn | 13.0% | 7.3%(+5.63)#45 | 5.8%(+7.21)#1,205 |
| 46. | Dayton | 12.8% | 7.3%(+5.45)#46 | 5.8%(+7.02)#1,254 |
| 47. | New Kent | 12.7% | 7.3%(+5.40)#47 | 5.8%(+6.98)#1,273 |
| 48. | Oakton | 12.7% | 7.3%(+5.36)#48 | 5.8%(+6.94)#1,277 |
| 49. | Franconia | 12.6% | 7.3%(+5.27)#49 | 5.8%(+6.85)#1,298 |
| 50. | Wolf Trap | 12.5% | 7.3%(+5.17)#50 | 5.8%(+6.75)#1,320 |
| 51. | Huntington | 12.5% | 7.3%(+5.12)#51 | 5.8%(+6.70)#1,345 |
| 52. | Ashburn | 12.4% | 7.3%(+5.09)#52 | 5.8%(+6.66)#1,354 |
| 53. | Camptown | 12.4% | 7.3%(+5.08)#53 | 5.8%(+6.66)#1,358 |
| 54. | Crosspointe | 12.4% | 7.3%(+5.07)#54 | 5.8%(+6.65)#1,361 |
| 55. | Modest Town | 12.4% | 7.3%(+5.03)#55 | 5.8%(+6.61)#1,368 |
| 56. | Ravensworth | 12.3% | 7.3%(+5.00)#56 | 5.8%(+6.57)#1,375 |
| 57. | Hayfield | 12.3% | 7.3%(+4.99)#57 | 5.8%(+6.57)#1,377 |
| 58. | Pimmit Hills | 12.2% | 7.3%(+4.88)#58 | 5.8%(+6.46)#1,407 |
| 59. | Bassett | 12.2% | 7.3%(+4.85)#59 | 5.8%(+6.42)#1,422 |
| 60. | Cherry Hill | 12.1% | 7.3%(+4.75)#60 | 5.8%(+6.33)#1,456 |
| 61. | Newington | 12.1% | 7.3%(+4.74)#61 | 5.8%(+6.31)#1,467 |
| 62. | Newington Forest | 12.1% | 7.3%(+4.72)#62 | 5.8%(+6.30)#1,473 |
| 63. | Alexandria | 12.0% | 7.3%(+4.70)#63 | 5.8%(+6.27)#1,482 |
| 64. | Broadlands | 12.0% | 7.3%(+4.67)#64 | 5.8%(+6.25)#1,489 |
| 65. | Falls Church | 11.8% | 7.3%(+4.47)#65 | 5.8%(+6.05)#1,551 |
| 66. | Union Mill | 11.8% | 7.3%(+4.44)#66 | 5.8%(+6.01)#1,565 |
| 67. | University Center | 11.7% | 7.3%(+4.37)#67 | 5.8%(+5.94)#1,598 |
| 68. | Massanetta Springs | 11.7% | 7.3%(+4.35)#68 | 5.8%(+5.93)#1,607 |
| 69. | Reston | 11.7% | 7.3%(+4.35)#69 | 5.8%(+5.92)#1,609 |
| 70. | Brambleton | 11.7% | 7.3%(+4.31)#70 | 5.8%(+5.89)#1,628 |
| 71. | Long Branch | 11.5% | 7.3%(+4.13)#71 | 5.8%(+5.70)#1,699 |
| 72. | Floris | 11.5% | 7.3%(+4.12)#72 | 5.8%(+5.70)#1,700 |
| 73. | Hutchison | 11.4% | 7.3%(+4.11)#73 | 5.8%(+5.68)#1,710 |
| 74. | Augusta Springs | 11.4% | 7.3%(+4.06)#74 | 5.8%(+5.63)#1,728 |
| 75. | Cascades | 11.4% | 7.3%(+4.02)#75 | 5.8%(+5.60)#1,746 |
| 76. | Mclean | 11.3% | 7.3%(+4.00)#76 | 5.8%(+5.57)#1,756 |
| 77. | County Center | 11.3% | 7.3%(+3.99)#77 | 5.8%(+5.56)#1,759 |
| 78. | Mount Clifton | 11.3% | 7.3%(+3.98)#78 | 5.8%(+5.56)#1,763 |
| 79. | Hamilton | 11.3% | 7.3%(+3.95)#79 | 5.8%(+5.53)#1,775 |
| 80. | Belmont | 11.3% | 7.3%(+3.95)#80 | 5.8%(+5.53)#1,777 |
| 81. | Temperanceville | 11.2% | 7.3%(+3.86)#81 | 5.8%(+5.44)#1,809 |
| 82. | Moorefield | 11.2% | 7.3%(+3.84)#82 | 5.8%(+5.41)#1,821 |
| 83. | Lincolnia | 11.1% | 7.3%(+3.78)#83 | 5.8%(+5.35)#1,838 |
| 84. | Wyndham | 11.1% | 7.3%(+3.77)#84 | 5.8%(+5.35)#1,855 |
| 85. | Lansdowne | 11.0% | 7.3%(+3.69)#85 | 5.8%(+5.26)#1,893 |
| 86. | South Riding | 11.0% | 7.3%(+3.66)#86 | 5.8%(+5.24)#1,907 |
| 87. | Countryside | 10.9% | 7.3%(+3.59)#87 | 5.8%(+5.17)#1,937 |
| 88. | New Baltimore | 10.8% | 7.3%(+3.50)#88 | 5.8%(+5.07)#1,976 |
| 89. | Centreville | 10.6% | 7.3%(+3.31)#89 | 5.8%(+4.89)#2,077 |
| 90. | Idylwood | 10.6% | 7.3%(+3.30)#90 | 5.8%(+4.88)#2,082 |
| 91. | Burke Centre | 10.6% | 7.3%(+3.26)#91 | 5.8%(+4.84)#2,101 |
| 92. | Mount Vernon | 10.6% | 7.3%(+3.23)#92 | 5.8%(+4.80)#2,131 |
| 93. | Glen Allen | 10.5% | 7.3%(+3.18)#93 | 5.8%(+4.76)#2,154 |
| 94. | Woodlake | 10.5% | 7.3%(+3.18)#94 | 5.8%(+4.75)#2,155 |
| 95. | West Falls Church | 10.5% | 7.3%(+3.15)#95 | 5.8%(+4.72)#2,161 |
| 96. | Laurel Hill | 10.4% | 7.3%(+3.09)#96 | 5.8%(+4.66)#2,190 |
| 97. | West Springfield | 10.3% | 7.3%(+3.00)#97 | 5.8%(+4.58)#2,236 |
| 98. | Clifton | 10.3% | 7.3%(+2.99)#98 | 5.8%(+4.56)#2,242 |
| 99. | Triangle | 10.3% | 7.3%(+2.95)#99 | 5.8%(+4.52)#2,269 |
| 100. | Arcola | 10.3% | 7.3%(+2.93)#100 | 5.8%(+4.50)#2,279 |
Common Questions
What are the Top 10 Cities with the Highest Percentage of Population Employed in Business & Financial in Virginia?
Top 10 Cities with the Highest Percentage of Population Employed in Business & Financial in Virginia are:
#1
86.8%
#2
27.1%
#3
26.9%
#4
26.2%
#5
23.3%
#6
20.7%
#7
20.0%
#8
19.9%
#9
19.8%
#10
18.8%
What city has the Highest Percentage of Population Employed in Business & Financial in Virginia?
Bobtown has the Highest Percentage of Population Employed in Business & Financial in Virginia with 86.8%.
What is the Percentage of Population Employed in Business & Financial in the State of Virginia?
Percentage of Population Employed in Business & Financial in Virginia is 7.3%.
What is the Percentage of Population Employed in Business & Financial in the United States?
Percentage of Population Employed in Business & Financial in the United States is 5.8%.