Cities with the Highest Percentage of Population Employed in Business & Financial in Vermont
RELATED REPORTS & OPTIONS
Business & Financial
Vermont
Compare Cities
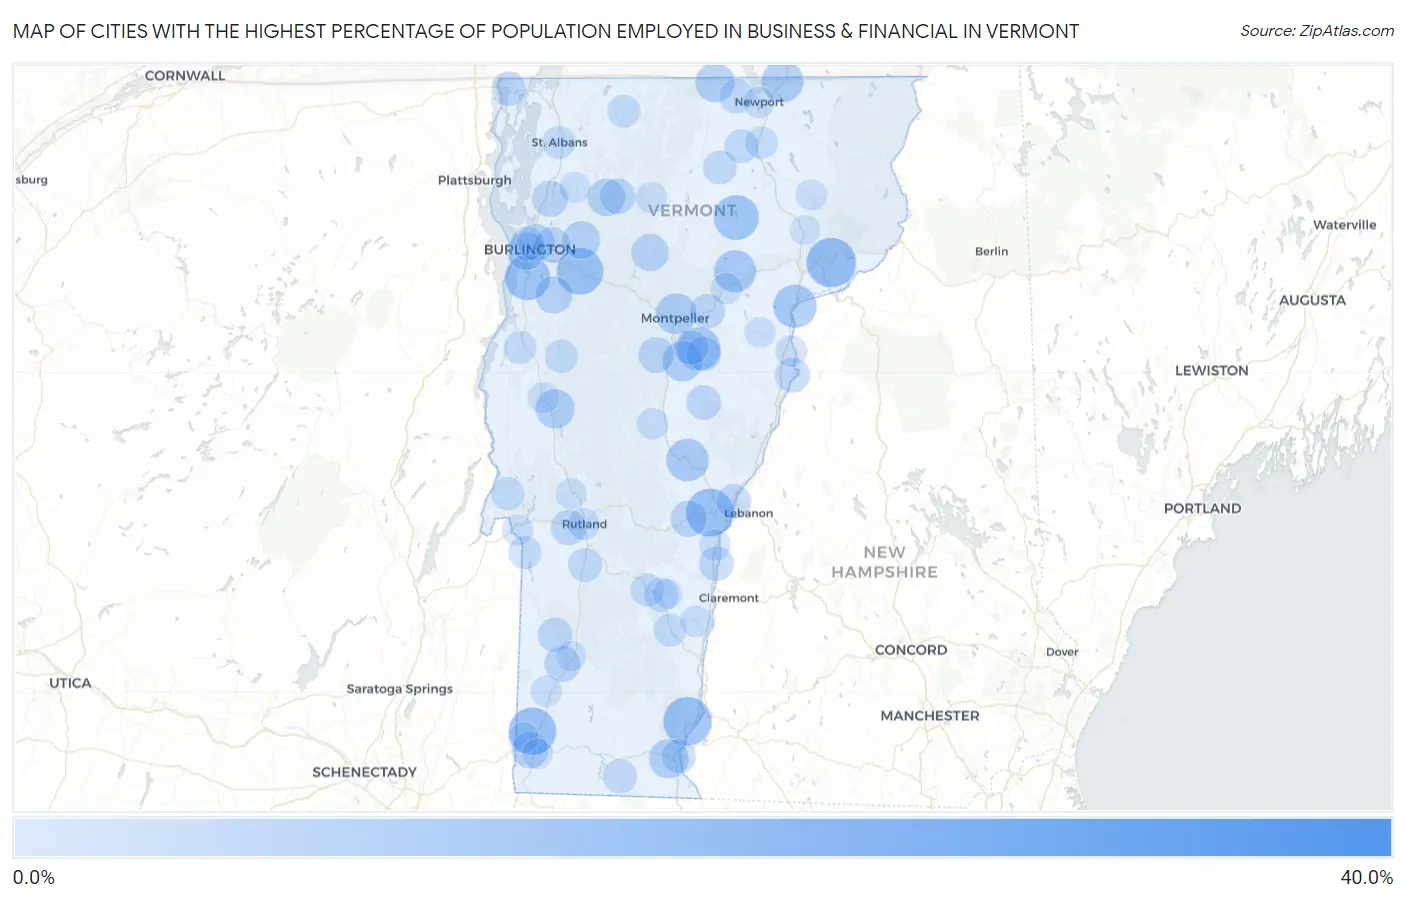
Map of Cities with the Highest Percentage of Population Employed in Business & Financial in Vermont
0.0%
40.0%
Cities with the Highest Percentage of Population Employed in Business & Financial in Vermont
| City | % Employed | vs State | vs National | |
| 1. | Underhill Center | 40.0% | 5.0%(+35.0)#1 | 5.8%(+34.2)#88 |
| 2. | Bolton | 40.0% | 5.0%(+35.0)#2 | 5.8%(+34.2)#89 |
| 3. | Hanksville | 29.2% | 5.0%(+24.1)#3 | 5.8%(+23.4)#182 |
| 4. | Concord | 18.0% | 5.0%(+13.0)#4 | 5.8%(+12.3)#496 |
| 5. | Putney | 17.3% | 5.0%(+12.3)#5 | 5.8%(+11.6)#535 |
| 6. | Quechee | 16.7% | 5.0%(+11.6)#6 | 5.8%(+10.9)#584 |
| 7. | South Shaftsbury | 16.3% | 5.0%(+11.3)#7 | 5.8%(+10.6)#624 |
| 8. | Richmond | 15.8% | 5.0%(+10.8)#8 | 5.8%(+10.0)#681 |
| 9. | Shelburne | 14.7% | 5.0%(+9.61)#9 | 5.8%(+8.89)#852 |
| 10. | Hartford | 14.3% | 5.0%(+9.24)#10 | 5.8%(+8.52)#905 |
| 11. | Bolton Valley | 14.3% | 5.0%(+9.24)#11 | 5.8%(+8.52)#907 |
| 12. | Greensboro | 14.3% | 5.0%(+9.24)#12 | 5.8%(+8.52)#910 |
| 13. | Wolcott | 13.3% | 5.0%(+8.29)#13 | 5.8%(+7.57)#1,106 |
| 14. | Websterville | 13.1% | 5.0%(+8.02)#14 | 5.8%(+7.31)#1,177 |
| 15. | Barnet | 12.9% | 5.0%(+7.86)#15 | 5.8%(+7.14)#1,228 |
| 16. | South Royalton | 12.4% | 5.0%(+7.36)#16 | 5.8%(+6.65)#1,360 |
| 17. | Cabot | 11.9% | 5.0%(+6.88)#17 | 5.8%(+6.16)#1,511 |
| 18. | Derby Line | 11.7% | 5.0%(+6.64)#18 | 5.8%(+5.92)#1,611 |
| 19. | South Lincoln | 11.2% | 5.0%(+6.17)#19 | 5.8%(+5.45)#1,801 |
| 20. | Castleton Four Corners | 11.2% | 5.0%(+6.12)#20 | 5.8%(+5.41)#1,823 |
| 21. | Montpelier | 11.1% | 5.0%(+6.07)#21 | 5.8%(+5.35)#1,837 |
| 22. | Peacham | 11.1% | 5.0%(+6.06)#22 | 5.8%(+5.35)#1,844 |
| 23. | South Hero | 11.0% | 5.0%(+5.94)#23 | 5.8%(+5.23)#1,914 |
| 24. | Williamstown | 10.3% | 5.0%(+5.29)#24 | 5.8%(+4.58)#2,235 |
| 25. | North Troy | 9.7% | 5.0%(+4.65)#25 | 5.8%(+3.94)#2,624 |
| 26. | West Brattleboro | 9.7% | 5.0%(+4.63)#26 | 5.8%(+3.92)#2,638 |
| 27. | East Middlebury | 9.4% | 5.0%(+4.39)#27 | 5.8%(+3.68)#2,802 |
| 28. | Jericho | 8.3% | 5.0%(+3.25)#28 | 5.8%(+2.53)#3,847 |
| 29. | South Burlington | 8.3% | 5.0%(+3.23)#29 | 5.8%(+2.52)#3,854 |
| 30. | Cambridge | 8.1% | 5.0%(+3.10)#30 | 5.8%(+2.39)#3,997 |
| 31. | Stowe | 7.9% | 5.0%(+2.89)#31 | 5.8%(+2.17)#4,243 |
| 32. | Hinesburg | 7.9% | 5.0%(+2.83)#32 | 5.8%(+2.12)#4,338 |
| 33. | Proctor | 7.9% | 5.0%(+2.80)#33 | 5.8%(+2.09)#4,364 |
| 34. | West Charlotte | 7.8% | 5.0%(+2.70)#34 | 5.8%(+1.99)#4,486 |
| 35. | Winooski | 7.6% | 5.0%(+2.55)#35 | 5.8%(+1.83)#4,681 |
| 36. | Woodstock | 7.3% | 5.0%(+2.29)#36 | 5.8%(+1.58)#4,963 |
| 37. | Lincoln | 7.3% | 5.0%(+2.27)#37 | 5.8%(+1.55)#5,007 |
| 38. | North Hyde Park | 7.3% | 5.0%(+2.24)#38 | 5.8%(+1.52)#5,051 |
| 39. | Old Bennington | 7.2% | 5.0%(+2.18)#39 | 5.8%(+1.47)#5,134 |
| 40. | St. George | 7.2% | 5.0%(+2.13)#40 | 5.8%(+1.41)#5,202 |
| 41. | Harmonyville | 7.0% | 5.0%(+1.96)#41 | 5.8%(+1.24)#5,432 |
| 42. | Milton | 7.0% | 5.0%(+1.96)#42 | 5.8%(+1.24)#5,433 |
| 43. | Manchester | 6.8% | 5.0%(+1.77)#43 | 5.8%(+1.06)#5,712 |
| 44. | Northfield | 6.8% | 5.0%(+1.75)#44 | 5.8%(+1.03)#5,760 |
| 45. | Essex Junction | 6.8% | 5.0%(+1.73)#45 | 5.8%(+1.02)#5,785 |
| 46. | Stamford | 6.8% | 5.0%(+1.73)#46 | 5.8%(+1.02)#5,790 |
| 47. | West Rutland | 6.5% | 5.0%(+1.48)#47 | 5.8%(+0.763)#6,201 |
| 48. | Jeffersonville | 6.5% | 5.0%(+1.46)#48 | 5.8%(+0.749)#6,227 |
| 49. | North Pownal | 6.5% | 5.0%(+1.43)#49 | 5.8%(+0.712)#6,282 |
| 50. | East Barre | 6.0% | 5.0%(+0.949)#50 | 5.8%(+0.233)#7,124 |
| 51. | Plainfield | 6.0% | 5.0%(+0.905)#51 | 5.8%(+0.190)#7,220 |
| 52. | Newbury | 5.9% | 5.0%(+0.899)#52 | 5.8%(+0.183)#7,235 |
| 53. | Chelsea | 5.9% | 5.0%(+0.835)#53 | 5.8%(+0.120)#7,363 |
| 54. | Dorset | 5.8% | 5.0%(+0.708)#54 | 5.8%(-0.007)#7,597 |
| 55. | Windsor | 5.7% | 5.0%(+0.612)#55 | 5.8%(-0.104)#7,791 |
| 56. | South Barre | 5.6% | 5.0%(+0.547)#56 | 5.8%(-0.168)#7,927 |
| 57. | Wilder | 5.5% | 5.0%(+0.481)#57 | 5.8%(-0.235)#8,078 |
| 58. | Alburgh | 5.5% | 5.0%(+0.458)#58 | 5.8%(-0.258)#8,122 |
| 59. | Newport Center | 5.4% | 5.0%(+0.388)#59 | 5.8%(-0.328)#8,296 |
| 60. | Burlington | 5.4% | 5.0%(+0.334)#60 | 5.8%(-0.381)#8,404 |
| 61. | Jacksonville | 5.4% | 5.0%(+0.329)#61 | 5.8%(-0.386)#8,416 |
| 62. | Brattleboro | 5.4% | 5.0%(+0.326)#62 | 5.8%(-0.390)#8,427 |
| 63. | Proctorsville | 5.3% | 5.0%(+0.293)#63 | 5.8%(-0.423)#8,495 |
| 64. | Wallingford | 5.2% | 5.0%(+0.148)#64 | 5.8%(-0.568)#8,820 |
| 65. | Albany | 5.1% | 5.0%(+0.055)#65 | 5.8%(-0.661)#9,023 |
| 66. | Irasburg | 5.0% | 5.0%(-0.047)#66 | 5.8%(-0.763)#9,245 |
| 67. | East Dorset | 4.7% | 5.0%(-0.313)#67 | 5.8%(-1.03)#9,852 |
| 68. | Ludlow | 4.7% | 5.0%(-0.347)#68 | 5.8%(-1.06)#9,933 |
| 69. | Bristol | 4.6% | 5.0%(-0.416)#69 | 5.8%(-1.13)#10,101 |
| 70. | Benson | 4.5% | 5.0%(-0.502)#70 | 5.8%(-1.22)#10,317 |
| 71. | St Albans | 4.5% | 5.0%(-0.517)#71 | 5.8%(-1.23)#10,363 |
| 72. | Vergennes | 4.4% | 5.0%(-0.674)#72 | 5.8%(-1.39)#10,784 |
| 73. | Chester | 4.4% | 5.0%(-0.674)#73 | 5.8%(-1.39)#10,786 |
| 74. | Enosburg Falls | 4.3% | 5.0%(-0.706)#74 | 5.8%(-1.42)#10,885 |
| 75. | Poultney | 4.3% | 5.0%(-0.755)#75 | 5.8%(-1.47)#10,988 |
| 76. | Orleans | 4.2% | 5.0%(-0.854)#76 | 5.8%(-1.57)#11,249 |
| 77. | Middletown Springs | 3.9% | 5.0%(-1.10)#77 | 5.8%(-1.82)#11,864 |
| 78. | Rutland | 3.7% | 5.0%(-1.34)#78 | 5.8%(-2.06)#12,564 |
| 79. | Springfield | 3.6% | 5.0%(-1.45)#79 | 5.8%(-2.17)#12,889 |
| 80. | Huntington | 3.5% | 5.0%(-1.56)#80 | 5.8%(-2.28)#13,209 |
| 81. | Wells River | 3.4% | 5.0%(-1.66)#81 | 5.8%(-2.37)#13,491 |
| 82. | Marshfield | 3.2% | 5.0%(-1.80)#82 | 5.8%(-2.52)#13,894 |
| 83. | Randolph | 3.2% | 5.0%(-1.88)#83 | 5.8%(-2.60)#14,154 |
| 84. | Middlebury | 3.1% | 5.0%(-1.90)#84 | 5.8%(-2.62)#14,224 |
| 85. | Arlington | 3.1% | 5.0%(-1.91)#85 | 5.8%(-2.63)#14,262 |
| 86. | Johnson | 3.1% | 5.0%(-1.92)#86 | 5.8%(-2.64)#14,281 |
| 87. | Newport | 3.0% | 5.0%(-2.01)#87 | 5.8%(-2.72)#14,533 |
| 88. | Hartland | 3.0% | 5.0%(-2.02)#88 | 5.8%(-2.73)#14,578 |
| 89. | West Burke | 2.9% | 5.0%(-2.11)#89 | 5.8%(-2.82)#14,874 |
| 90. | Fairfax | 2.9% | 5.0%(-2.11)#90 | 5.8%(-2.83)#14,892 |
| 91. | Pownal Center | 2.9% | 5.0%(-2.12)#91 | 5.8%(-2.84)#14,922 |
| 92. | Pittsford | 2.9% | 5.0%(-2.15)#92 | 5.8%(-2.87)#15,029 |
| 93. | Fair Haven | 2.9% | 5.0%(-2.17)#93 | 5.8%(-2.88)#15,080 |
| 94. | Groton | 2.8% | 5.0%(-2.26)#94 | 5.8%(-2.97)#15,350 |
| 95. | North Bennington | 2.7% | 5.0%(-2.30)#95 | 5.8%(-3.02)#15,498 |
| 96. | Pawlet | 2.5% | 5.0%(-2.53)#96 | 5.8%(-3.24)#16,222 |
| 97. | Bennington | 2.3% | 5.0%(-2.73)#97 | 5.8%(-3.44)#16,861 |
| 98. | Lyndonville | 2.3% | 5.0%(-2.76)#98 | 5.8%(-3.47)#16,942 |
| 99. | Manchester Center | 2.2% | 5.0%(-2.83)#99 | 5.8%(-3.55)#17,205 |
| 100. | Cavendish | 2.0% | 5.0%(-3.03)#100 | 5.8%(-3.74)#17,828 |
1
2Common Questions
What are the Top 10 Cities with the Highest Percentage of Population Employed in Business & Financial in Vermont?
Top 10 Cities with the Highest Percentage of Population Employed in Business & Financial in Vermont are:
#1
18.0%
#2
17.3%
#3
16.7%
#4
16.3%
#5
15.8%
#6
14.7%
#7
14.3%
#8
13.1%
#9
12.9%
#10
12.4%
What city has the Highest Percentage of Population Employed in Business & Financial in Vermont?
Concord has the Highest Percentage of Population Employed in Business & Financial in Vermont with 18.0%.
What is the Percentage of Population Employed in Business & Financial in the State of Vermont?
Percentage of Population Employed in Business & Financial in Vermont is 5.0%.
What is the Percentage of Population Employed in Business & Financial in the United States?
Percentage of Population Employed in Business & Financial in the United States is 5.8%.