Cities with the Highest Percentage of Population Employed in Business & Financial in South Carolina
RELATED REPORTS & OPTIONS
Business & Financial
South Carolina
Compare Cities
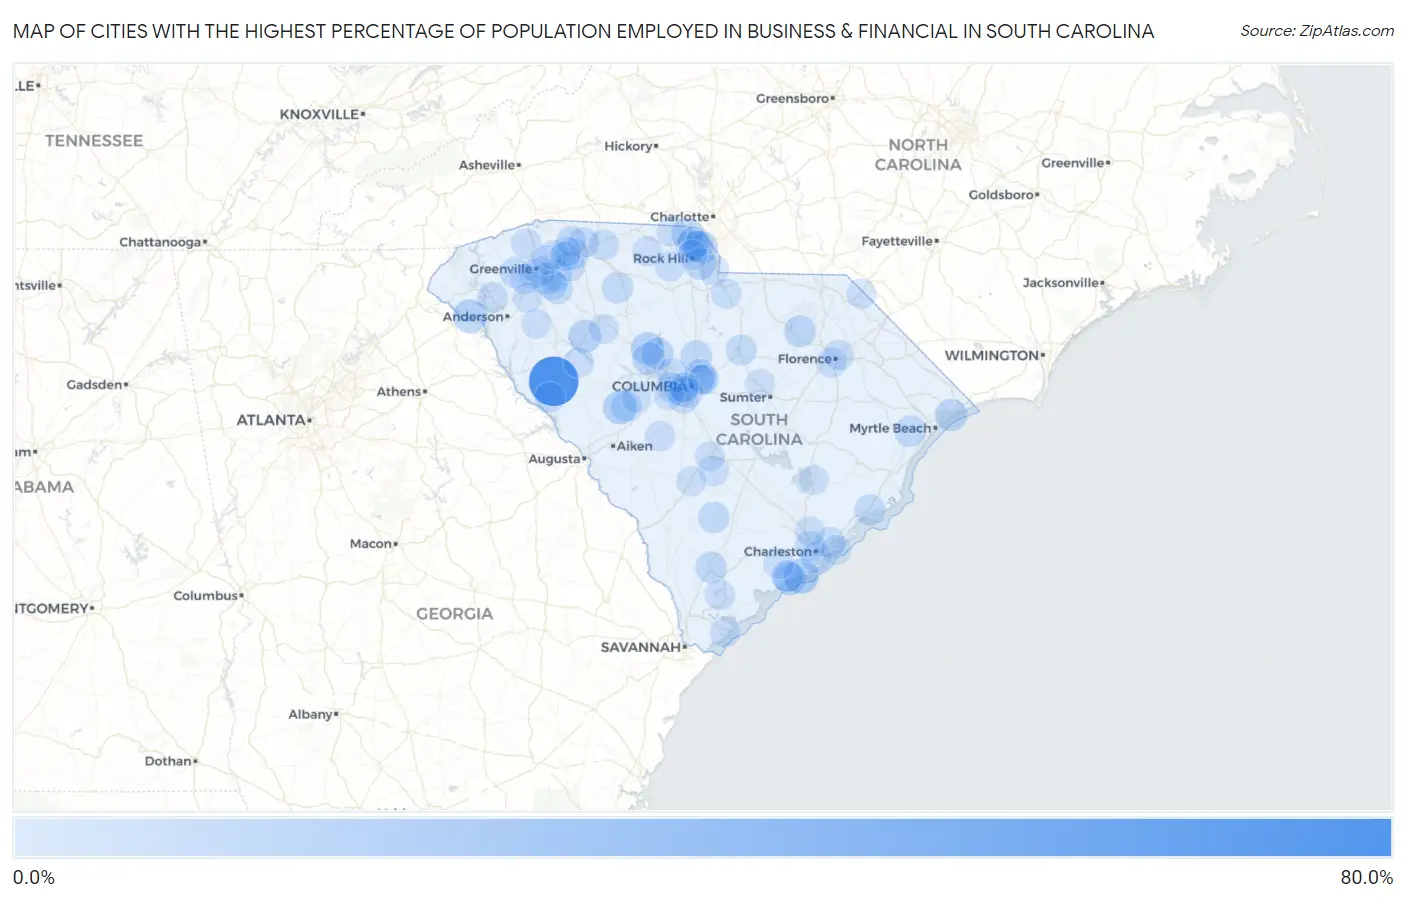
Map of Cities with the Highest Percentage of Population Employed in Business & Financial in South Carolina
0.0%
80.0%
Cities with the Highest Percentage of Population Employed in Business & Financial in South Carolina
| City | % Employed | vs State | vs National | |
| 1. | Bradley | 65.6% | 4.6%(+61.1)#1 | 5.8%(+59.9)#30 |
| 2. | Kiawah Island | 19.2% | 4.6%(+14.6)#2 | 5.8%(+13.4)#434 |
| 3. | Ridge Spring | 16.4% | 4.6%(+11.8)#3 | 5.8%(+10.6)#621 |
| 4. | Fair Play | 16.2% | 4.6%(+11.6)#4 | 5.8%(+10.4)#645 |
| 5. | Floydale | 14.8% | 4.6%(+10.2)#5 | 5.8%(+9.01)#835 |
| 6. | Harbor Island | 14.1% | 4.6%(+9.49)#6 | 5.8%(+8.30)#949 |
| 7. | Pomaria | 14.0% | 4.6%(+9.38)#7 | 5.8%(+8.19)#961 |
| 8. | Fort Mill | 13.6% | 4.6%(+9.07)#8 | 5.8%(+7.88)#1,018 |
| 9. | Seabrook Island | 13.6% | 4.6%(+9.03)#9 | 5.8%(+7.83)#1,034 |
| 10. | Mountville | 13.4% | 4.6%(+8.83)#10 | 5.8%(+7.64)#1,090 |
| 11. | Baxter | 12.8% | 4.6%(+8.20)#11 | 5.8%(+7.01)#1,263 |
| 12. | Little Mountain | 12.5% | 4.6%(+7.93)#12 | 5.8%(+6.74)#1,322 |
| 13. | Peak | 11.8% | 4.6%(+7.20)#13 | 5.8%(+6.00)#1,575 |
| 14. | Briarcliffe Acres | 11.6% | 4.6%(+7.02)#14 | 5.8%(+5.83)#1,650 |
| 15. | Wellford | 11.5% | 4.6%(+6.92)#15 | 5.8%(+5.73)#1,689 |
| 16. | India Hook | 11.5% | 4.6%(+6.90)#16 | 5.8%(+5.71)#1,694 |
| 17. | North Hartsville | 11.1% | 4.6%(+6.55)#17 | 5.8%(+5.36)#1,836 |
| 18. | Dunbar | 11.0% | 4.6%(+6.47)#18 | 5.8%(+5.28)#1,889 |
| 19. | Lake Wylie | 11.0% | 4.6%(+6.43)#19 | 5.8%(+5.24)#1,905 |
| 20. | Tega Cay | 11.0% | 4.6%(+6.40)#20 | 5.8%(+5.21)#1,923 |
| 21. | Lesslie | 10.6% | 4.6%(+5.98)#21 | 5.8%(+4.79)#2,136 |
| 22. | Blythewood | 10.3% | 4.6%(+5.71)#22 | 5.8%(+4.51)#2,276 |
| 23. | Olympia | 10.0% | 4.6%(+5.43)#23 | 5.8%(+4.24)#2,429 |
| 24. | Dentsville | 9.9% | 4.6%(+5.35)#24 | 5.8%(+4.16)#2,495 |
| 25. | Yemassee | 9.8% | 4.6%(+5.22)#25 | 5.8%(+4.02)#2,575 |
| 26. | Rockville | 9.8% | 4.6%(+5.19)#26 | 5.8%(+3.99)#2,595 |
| 27. | Five Forks | 9.6% | 4.6%(+5.06)#27 | 5.8%(+3.86)#2,676 |
| 28. | Bucksport | 9.6% | 4.6%(+5.04)#28 | 5.8%(+3.85)#2,685 |
| 29. | Debordieu Colony | 9.4% | 4.6%(+4.86)#29 | 5.8%(+3.67)#2,808 |
| 30. | Mcclellanville | 9.4% | 4.6%(+4.84)#30 | 5.8%(+3.65)#2,832 |
| 31. | Riverview | 9.4% | 4.6%(+4.83)#31 | 5.8%(+3.64)#2,835 |
| 32. | Williams | 9.3% | 4.6%(+4.69)#32 | 5.8%(+3.50)#2,966 |
| 33. | Forest Acres | 9.1% | 4.6%(+4.51)#33 | 5.8%(+3.32)#3,122 |
| 34. | Mauldin | 9.0% | 4.6%(+4.47)#34 | 5.8%(+3.28)#3,152 |
| 35. | Buffalo | 9.0% | 4.6%(+4.38)#35 | 5.8%(+3.19)#3,219 |
| 36. | Grover | 8.5% | 4.6%(+3.88)#36 | 5.8%(+2.69)#3,692 |
| 37. | Danwood | 8.3% | 4.6%(+3.73)#37 | 5.8%(+2.54)#3,845 |
| 38. | James Island | 8.2% | 4.6%(+3.67)#38 | 5.8%(+2.48)#3,893 |
| 39. | Irmo | 8.2% | 4.6%(+3.61)#39 | 5.8%(+2.42)#3,954 |
| 40. | Fountain Inn | 8.2% | 4.6%(+3.60)#40 | 5.8%(+2.40)#3,970 |
| 41. | Capitol View | 8.0% | 4.6%(+3.45)#41 | 5.8%(+2.26)#4,155 |
| 42. | Camden | 8.0% | 4.6%(+3.40)#42 | 5.8%(+2.21)#4,205 |
| 43. | Monetta | 8.0% | 4.6%(+3.39)#43 | 5.8%(+2.19)#4,222 |
| 44. | Easley | 7.9% | 4.6%(+3.31)#44 | 5.8%(+2.12)#4,334 |
| 45. | Ben Avon | 7.8% | 4.6%(+3.26)#45 | 5.8%(+2.06)#4,392 |
| 46. | Sandy Springs | 7.8% | 4.6%(+3.24)#46 | 5.8%(+2.05)#4,415 |
| 47. | Litchfield Beach | 7.8% | 4.6%(+3.23)#47 | 5.8%(+2.04)#4,425 |
| 48. | Mount Pleasant | 7.6% | 4.6%(+3.08)#48 | 5.8%(+1.88)#4,630 |
| 49. | Charleston | 7.5% | 4.6%(+2.93)#49 | 5.8%(+1.74)#4,795 |
| 50. | Cayce | 7.4% | 4.6%(+2.81)#50 | 5.8%(+1.62)#4,924 |
| 51. | Greenville | 7.2% | 4.6%(+2.61)#51 | 5.8%(+1.41)#5,204 |
| 52. | Boiling Springs | 7.2% | 4.6%(+2.60)#52 | 5.8%(+1.40)#5,220 |
| 53. | Pendleton | 7.1% | 4.6%(+2.57)#53 | 5.8%(+1.38)#5,239 |
| 54. | Cowpens | 6.9% | 4.6%(+2.32)#54 | 5.8%(+1.13)#5,613 |
| 55. | Oak Grove | 6.9% | 4.6%(+2.30)#55 | 5.8%(+1.11)#5,632 |
| 56. | Lexington | 6.8% | 4.6%(+2.23)#56 | 5.8%(+1.04)#5,755 |
| 57. | Quinby | 6.7% | 4.6%(+2.17)#57 | 5.8%(+0.976)#5,861 |
| 58. | Mccormick | 6.7% | 4.6%(+2.14)#58 | 5.8%(+0.949)#5,911 |
| 59. | Keowee Key | 6.6% | 4.6%(+2.07)#59 | 5.8%(+0.878)#6,025 |
| 60. | Meggett | 6.6% | 4.6%(+2.02)#60 | 5.8%(+0.828)#6,105 |
| 61. | Slater Marietta | 6.5% | 4.6%(+1.95)#61 | 5.8%(+0.754)#6,215 |
| 62. | Inman | 6.4% | 4.6%(+1.84)#62 | 5.8%(+0.644)#6,393 |
| 63. | Ninety Six | 6.3% | 4.6%(+1.76)#63 | 5.8%(+0.565)#6,516 |
| 64. | Mcconnells | 6.3% | 4.6%(+1.72)#64 | 5.8%(+0.527)#6,563 |
| 65. | Florence | 6.3% | 4.6%(+1.69)#65 | 5.8%(+0.498)#6,614 |
| 66. | Reidville | 6.2% | 4.6%(+1.67)#66 | 5.8%(+0.474)#6,674 |
| 67. | Drayton | 6.2% | 4.6%(+1.64)#67 | 5.8%(+0.444)#6,709 |
| 68. | Simpsonville | 6.2% | 4.6%(+1.63)#68 | 5.8%(+0.434)#6,733 |
| 69. | Perry | 6.2% | 4.6%(+1.63)#69 | 5.8%(+0.432)#6,741 |
| 70. | Clover | 6.2% | 4.6%(+1.62)#70 | 5.8%(+0.427)#6,755 |
| 71. | Dunean | 6.1% | 4.6%(+1.52)#71 | 5.8%(+0.322)#6,960 |
| 72. | Rowesville | 6.1% | 4.6%(+1.51)#72 | 5.8%(+0.318)#6,968 |
| 73. | Powdersville | 6.0% | 4.6%(+1.39)#73 | 5.8%(+0.194)#7,208 |
| 74. | Hickory Grove | 5.9% | 4.6%(+1.36)#74 | 5.8%(+0.170)#7,260 |
| 75. | Pine Ridge | 5.9% | 4.6%(+1.32)#75 | 5.8%(+0.130)#7,338 |
| 76. | Van Wyck | 5.9% | 4.6%(+1.31)#76 | 5.8%(+0.120)#7,360 |
| 77. | Springdale | 5.9% | 4.6%(+1.28)#77 | 5.8%(+0.089)#7,417 |
| 78. | Laurel Bay | 5.8% | 4.6%(+1.23)#78 | 5.8%(+0.038)#7,505 |
| 79. | Elgin | 5.7% | 4.6%(+1.18)#79 | 5.8%(-0.017)#7,611 |
| 80. | Greer | 5.7% | 4.6%(+1.15)#80 | 5.8%(-0.048)#7,662 |
| 81. | Mccoll | 5.6% | 4.6%(+1.08)#81 | 5.8%(-0.113)#7,812 |
| 82. | Hilton Head Island | 5.6% | 4.6%(+1.07)#82 | 5.8%(-0.120)#7,830 |
| 83. | Isle Of Palms | 5.6% | 4.6%(+1.00)#83 | 5.8%(-0.190)#7,967 |
| 84. | Rock Hill | 5.5% | 4.6%(+0.947)#84 | 5.8%(-0.247)#8,100 |
| 85. | Taylors | 5.5% | 4.6%(+0.923)#85 | 5.8%(-0.271)#8,155 |
| 86. | Columbia | 5.5% | 4.6%(+0.903)#86 | 5.8%(-0.291)#8,217 |
| 87. | Honea Path | 5.4% | 4.6%(+0.868)#87 | 5.8%(-0.325)#8,287 |
| 88. | Joanna | 5.4% | 4.6%(+0.854)#88 | 5.8%(-0.340)#8,323 |
| 89. | Woodfield | 5.4% | 4.6%(+0.824)#89 | 5.8%(-0.369)#8,376 |
| 90. | Batesburg Leesville | 5.4% | 4.6%(+0.807)#90 | 5.8%(-0.387)#8,418 |
| 91. | Lyman | 5.4% | 4.6%(+0.794)#91 | 5.8%(-0.399)#8,449 |
| 92. | Red Bank | 5.3% | 4.6%(+0.776)#92 | 5.8%(-0.417)#8,474 |
| 93. | West Pelzer | 5.3% | 4.6%(+0.756)#93 | 5.8%(-0.437)#8,527 |
| 94. | Bonneau | 5.3% | 4.6%(+0.750)#94 | 5.8%(-0.443)#8,535 |
| 95. | Hanahan | 5.3% | 4.6%(+0.740)#95 | 5.8%(-0.453)#8,561 |
| 96. | Duncan | 5.3% | 4.6%(+0.729)#96 | 5.8%(-0.465)#8,581 |
| 97. | Bamberg | 5.2% | 4.6%(+0.653)#97 | 5.8%(-0.540)#8,754 |
| 98. | Orangeburg | 5.1% | 4.6%(+0.551)#98 | 5.8%(-0.643)#8,990 |
| 99. | West Columbia | 5.1% | 4.6%(+0.531)#99 | 5.8%(-0.662)#9,028 |
| 100. | Dalzell | 5.1% | 4.6%(+0.516)#100 | 5.8%(-0.678)#9,057 |
Common Questions
What are the Top 10 Cities with the Highest Percentage of Population Employed in Business & Financial in South Carolina?
Top 10 Cities with the Highest Percentage of Population Employed in Business & Financial in South Carolina are:
#1
65.6%
#2
19.2%
#3
16.4%
#4
16.2%
#5
14.0%
#6
13.6%
#7
13.6%
#8
13.4%
#9
12.5%
#10
11.8%
What city has the Highest Percentage of Population Employed in Business & Financial in South Carolina?
Bradley has the Highest Percentage of Population Employed in Business & Financial in South Carolina with 65.6%.
What is the Percentage of Population Employed in Business & Financial in the State of South Carolina?
Percentage of Population Employed in Business & Financial in South Carolina is 4.6%.
What is the Percentage of Population Employed in Business & Financial in the United States?
Percentage of Population Employed in Business & Financial in the United States is 5.8%.